Commodity Prices – Protecting Your Investment

So much of what is written about commodity trading has to do with investment strategy; what you should buy, how much you should pay, or which tropical island you should buy with all of your profits. While the positive side of investing cannot be emphasized enough, an important part of your trading plan is knowing what to do when things don’t go so well. Commodity prices and how they can change require you find ways to protect your investments.
Two of the best ways to protect your investments against commodity price changes are limit orders and stop loss orders. These are both protective orders that help you keep your money, not give it away to changes in commodity prices.

Limit Order

A limit order is a futures trading order that instructs your broker that when an underlying asset reaches a certain price or better, he or she should execute the order and purchase the desired asset at the best commodity price available. If the price of a commodity does not drop to the requested level, your order is not filled.

For example, if the price of corn futures is at $5.00 dollars per bushel and you place a limit order at $4.50, your order will not fill unless the price drops to $4.50. If the commodity price falls from $4.75 to $4.40, your order will be filled at $4.40. Conversely, if the commodity price only falls to $4.55, your broker will not fill the order. This type of market order helps protect your money by getting you the commodity price you want and not filling if your price isn’t reached.

Stop Loss Order

A stop loss order is a commodities trading order that instructs your broker that if an asset you are holding drops to a certain level, he or she should sell it. Once the price has been reached, the commodity broker will implement the trade, regardless of the current commodity price. If the price never falls to the agreed amount, the order will not be executed.

As an example, if you enter a stop loss order to leave a crude oil position you are holding when the price drops to $55 a barrel, your oil futures have these possible scenarios:

  • If the price of oil drops to $55, your commodity broker will enter a market order to sell your position, getting the best available price.
  • If the price of oil drops to $55 but then quickly drops to $54, that may be the price you get. Remember, once the price touches $55, your broker will place a market order but that space of time can allow the price to temporarily drop more.
  • If the price of oil drops to $55 but then quickly rebounds to $56, the trade will be initiated ever though the amount is back above your target for the commodity price. It is likely you will get the $56 but your futures option will still get executed.

How These Orders Help Protect You

Commodity prices in the futures markets have the potential to move quickly. If you are holding a futures contract, it is easy for things to get volatile and your position can become compromised without your even knowing. By using limit orders, you can enter a position at the commodity price you choose, not pay more because you can’t monitor its movement; your broker can do the work of watching the commodity price for you.

Stop loss orders don’t protect you before you make a trade; they protect you AFTER you enter a position. If you are not sitting by the computer watching commodity prices, a negative move could occur before you can move to stop it. By having a stop loss order, you can watch your positions without being in front of your computer.

Conclusion

Stop loss orders and limit orders can help the investor to form part of a strong stop loss strategy. While there is plenty written about profits when commodity prices rise, it’s good to know you have a plan in place in case commodity prices fall.
 

Stock Market Crash – Not According to Candlestick Signals

There is constant speculation for the next stock market crash.  A stock market crash is always a worry for a certain percentage of the investment community. However, candlestick signals can greatly alleviate that fear.  A stock market crash does not occur in one day, one week, or one month. Selling will occur prior to a stock market crash.
The great stock market crash of October 1929 had clear evidence of selling in the markets starting in August of that year.  Each stock market crash in the 1980s and 1990s did not occur instantly. Candlestick sell signals made it clear that the directions of the markets were bearish well before the crashes occurred in. The signals will reveal the set up for another crash well before it occurs. Currently,  there are no indications that another stock market crash is in the making.

On the contrary, the Dow has been forming a rounding bottom formation for the past three months. This indicates a slow steady consolidation, a reaffirming that investor sentiment is gaining confidence. The fundamentals of the economy, low interest rates, improving earnings, and consistent consumer spending does not bode for anything but a strong steady economy.

Market Direction

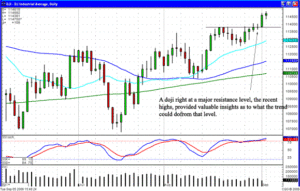
The Dow has recently broken out into new high territory for the past few years.  This occurring after the identification of a spreading pattern that formed in the Dow.  The result of a spreading pattern is a strong trend. In this case, the spreading pattern indicated a strong upward trend.  This could warrant an uptrend that could maintain for the next few weeks. Continue to hold your long positions.
 
Stock Market Crash Not Evident, Dow
 
Dow

The results of these scans in the past couple of trading days reveals strong buying coming back into the oil related stocks.  Although crude oil prices have dropped dramatically over the past month, it appears as if crude oil stock prices have ended their profit taking.  The next move should be a strong move to the upside.  At least one or two positions in the oil related area should be added to the portfolio at this time.

Growth Stocks

Growth stocks are those companies with shares whose earnings are expected to grow at an above average rate in comparison to the market. These stocks typically do not pay dividends because the companies opt to reinvest any retained earnings back into capital projects.

There are common characteristics among growth stocks as well as indicators that the stock investor can look for. These indicators can include the following:

1) Strong growth rate – This includes not only historic growth rates but also the projected growth rate when investing in stocks of this nature. The growth rate will vary between small and large companies but typically smaller companies need to have a 10% growth rate for the past five years to qualify whereas the larger companies need to have about 5% – 7% growth rate to qualify.

2) Strong return on equity (ROE) – You must compare a company’s ROE with the industry in which is presides as well as its five-year average when stock investing.

3) Earnings per share (EPS) – The earnings per share is very important as well when investing in growth stocks. Investors must be sure the company is translating its sales into earnings, and management must be controlling costs. Investors must take a look at pre-tax profit margins and they should exceed the past five-year average as well as the industry average.

4) Analysts also take a look at the business model for a company as well as its market position to be sure that this stock price can double in five years.

Growth Stocks vs. Value Stocks

Growth investors look for companies with fast growing revenues and earnings as well as rising stock prices. Growth investing focuses on stocks that are growing and that have the potential for continued growth. Value investors look for bargains. Bargains are stocks that are trading at low prices relative to earnings, or stocks that have low price to earnings ratios. Value investing looks for stocks that the market has under priced and it looks for stocks that have the potential to increase as the market corrects itself.

Which Type of Stock Is Better?

This depends on what is occurring in the stock market. During periods such as the late 1990’s, growth stocks did very well, however there were time periods when value stocks did better. Investors should just be sure to aim for portfolio diversification and shouldn’t only invest in one type of stock.


Market Direction

Simple candlestick rules makes investing very easy. It also makes investing very relaxed. As illustrated in the previous newsletter, maintaining short positions during February and March was not a high anxiety process. What fears creep into investor sentiment as profits continued to grow? Where should I take profits? Should I take it now so I lock in some profits? These questions constantly nag an investor as their short position profits keep growing as a downtrend persists. Too often, positions are closed because of the fear of giving back some of the profits that have built up. This anxiety can be greatly diminished when using simple candlestick rules.

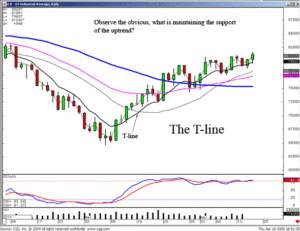
A downtrend will persist as long as there is not a candlestick buy signal and a close above the T. line. This rule works so well, an investor should be comfortable and relaxed with short positions until that combination occurs. The same is true in an uptrend. The Dow has moved up after the first week of March. What occurs in most humans as a trend continues? The anxiety level increases. They become more fearful of losing the profits they have made. This usually changes the investment strategy. The rational decision-making involved with analyzing the charts gives way to emotional factors. The sage investment advice, “Cut you loses short and let your profits run. ” Is a very viable investment process if investors would allow the discipline to work. Unfortunately, because of emotions, the opposite is usually true. The losses become greater while the gains get nipped in the bud because of the fear factor.

Candlestick analysis operates off very simple principles. Buy when the candlestick signals tell you to buy, and sell when the signals tell you it’s time to sell. Many investors have a difficult time when it comes time to sell. They either sell too early, in fear of giving back profits or they sell too late, afraid they might not get all of the price move. Candlestick analysis makes those problems very easy to overcome. The common sense rules the Japanese rice traders utilized for centuries allowed them to maximize profits and minimize losses. The signals and corroborating indicators take the subjectivity out of taking profits.

Growth Stocks, DOW

DOW

Another aspect of investing  benefited by recognizing the continuation of trends involves pattern analysis. Having the knowledge that current conditions of a market trend has not changed allows for the participation in candlestick patterns. These patterns may take much longer to set up. The end result of a pattern has a much better chance of creating huge profits if nothing dramatic  is occurring in the current overall trends. The Jayhook patterns, the Fry pan bottom pattern, the Cradle pattern and the Scoop pattern have better probabilities of success when the markets are gradually trending versus oscillating dramatically.

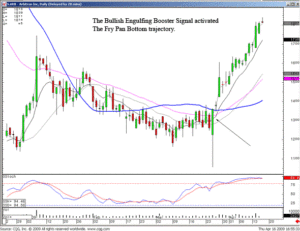
As illustrated in our recent recommendation on ARB, the dramatic buy signal escalated the result of a Fry pan bottom pattern. Since witnessing the Bullish Engulfing Booster signal, the upward trajectory of the trend has been very dramatic. The continuation of this price move as been benefited by the slow gradual uptrend of the markets in general. This trend may have had a much different result had the market indexes been producing a bearish trend.

Growth Stocks, ARB

ARB

The persistence of a trend also allows for the establishment of high profit option trading strategies. A general trending market diminishes the whip sawing actions in option trades that might been  found in more choppy conditions. Being able to analyze the market trend is greatly important for establishing the right investment strategies for the right times of the market. The information incorporated into each individual candlestick signal allows an investor to make much more accurate trend analysis than  other technical methods. The clarity produced by the signal bodies helps determine how heavily long or short a portfolio is positioned.

Chat session tonight 8 PM ET – open to everybody. With these market conditions, what option strategies should be used? Click here for instructions.

Good investing,

The Candlestick Forum Team


Scanning Techniques for Higher Profits

This Week’s Special

Scanning Techniques to Higher Profits – 30% OFF!

Streamline your stock selections with this step-by-step scanning technique.

Click here for details.

Website special reflects current newsletter. If you are reading an archived newsletter you will be directed to Current Website Special.


48 Hour Special

Trading Rules to Successful Profits – 30% OFF
 

American Depositary Receipts

America depositary receipts (ADRs) represent ownership of shares of a non-United States company that trades in United States financial markets. Many foreign stocks trade on US stock exchanges as level II or III ADRs. Through the purchase of American Depositary Receipts US investors can buy shares of promising foreign companies without needing to change to foreign currencies, collect dividends in foreign currencies, and deal with a stock broker in a foreign language. Owners of American Depositary Receipts receive dividends in US dollars, buy and sell just like buying stock and selling stock of American companies. In addition traders can follow these foreign stocks with technical analysis tools such as Candlestick analysis just like they do with US stocks.

American Depositary Receipts are issued by one of four US depositary banks, the Bank of New York Mellon, Citibank, Deutsche Bank or JPMorgan. ADRs represent a share, multiple shares, or a part of a share of the foreign stock in question. The owner of an American Depositary Receipt can, in fact, request and receive the foreign stock that the ADR represents but that really defeats the purpose and ease of trading an ADR. The American Depositary Receipt tracks the price of the foreign stock in its home market, adjusting for currency rate variation. As an ADR represents a foreign stock both fundamental analysis of the foreign company and technical analysis of market pricing in the USA are valuable in trading these replacements for foreign stocks.

It is level II American depositary receipts that are typically traded on US stock exchanges. Unsponsored shares and level I ADR fs are traded over the counter. This is a convenient way for many foreign companies to have their stocks traded in the USA. However, foreign stocks below the level II cutoff have minimal reporting requirements and the trader or investor dealing in these has many of the same problems as with penny stocks investing on the OTC market. Level II ADR fs must meet SEC filing requirements and are delisted from stock exchanges if they fail to do so. Level III ADRfs are typically from companies that are raising capital in the USA by selling stock. They are subject to much more strict reporting requirements, similar to American companies. Thus those interested in trading ADR fs or interested in long term investing in foreign companies will be able to trade level II and III American Depositary Receipts on a US stock exchange.

Trading stocks through the use of American Depositary Receipts allows US citizens access to promising means of picking offshore investments. Level II and III ADR fs provide sufficient information for investors and traders to do adequate fundamental and technical analysis of these stocks. It will be possible to not only determine a foreign stock fs margin of safety and intrinsic stock value but to be able to follow profitably with Candlestick patterns as well. Application of Candlestick trading tactics is possible with ADR fs as well as other US based stocks trading on US exchanges.


Market Direction

Wednesday’s trading had the opportunity to break the upper trend channel. However, the hard selling on Wednesday brought the trading back into the middle of the descending trend channel. Today’s trading took the Dow down to test the lower end of the trend channel after testing the upper trend line yesterday. These market conditions make it relatively difficult to trade anything more than a day or so at a time.

June 11 and 12th – Two Day Candlestick Signal Training

Utilizing candlestick signals effectively dramatically improve one’s ability to analyze what the overall trend of the market is doing. Your trading abilities will greatly improve when you understand what investor sentiment is doing at particular times of a trend. Your profitability greatly improves by knowing when to enter trades and exit trades at the most appropriate candlestick results. Whether daytrading, swing trading, or long term investing, the knowledge built into candlestick signals, when interpreted correctly, allows an investor to analyze price movements in the same manner that seasoned professionals do.

Chat session tonight at 8 PM ET, Everyone is welcome!

The Candlestick Forum Team


Website Special

5 -Star Trading Package-Quick Download – 25%OFF!!

Website special reflects current newsletter. If you are reading an archived newsletter you will be directed to Current Website Special

Commodity Options

Commodity options are a commonly used means of handling investment risk in trading commodity futures. By purchasing options contracts instead of directly purchasing futures contracts traders retain the right to buy or sell futures but have no obligation to do so. In using commodity options the trader will need to pay an option premium. However, the premium is the extent of his or her risk in options trading. In buying calls or buying puts in the commodities markets the trader can profit from a large shift in commodity prices but not suffer a loss if prices move in an unexpected direction. Traders selling puts and selling calls collect premiums in commodity options trading but also accept the risk of a large loss. Commodity and futures training will help the beginning trader get a handle of commodity options.

Commodity options are options on whether to buy or sell commodity futures. Commodity futures trading is contracting to buy or sell a standardized lot of a commodity at a future date. If the price of the commodity goes up or down substantially and in the desired direction the trader makes a handsome profit and if the commodity price moves adversely the loss can be devastating. By using commodity options the trader can buy a call or buy a put on a commodity futures contract. This will give him or her the right, but not the obligation, to buy or sell a commodity futures contract. If the trader believes that a commodity price is and will remain stable he or she may choose to sell puts or calls on the commodity. Providing that the price does remain stable the trader will gain the premium on each trade. Over the long term selling options is typically more profitable than buying. However, the trader needs to be able to withstand an occasional substantial loss.

Whether the trader is dealing directly with commodity futures or chooses to trade commodity options it is important to have a clear sense of the range of possibilities the commodity in question will offer. This starts with the basic fundamentals and then moves on to the technical aspects of the commodity market. Both fundamental and technical analysis come into play as fundamental analysis will help predict the spot price of the commodity at contract expiration and technical analysis will help predict daily price movement of the futures contract. The trader is best served by doing his or her fundamental and technical analysis on the commodity in question well in advance of trading it. When the trader is quite certain in his or her belief that a commodity price will go up or down it may be best to simply buy or sell a futures contract. It is when there is some uncertainty involved that the trader will purchase and options contract. Then, if the desired price move occurs the commodity trader will execute the options contract and buy or sell the commodity futures contract. If the desired price movement does not occur he or she will simply swallow the price of the premium as a cost of doing business and not suffer a loss in direct commodity trading.


Market Direction

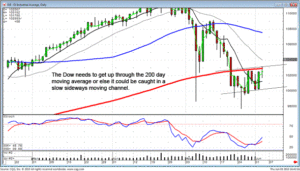
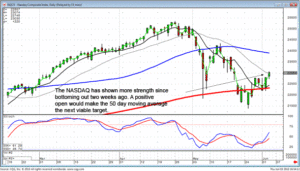
What is the market telling us? The Dow has been in the oversold condition and exhibiting candlestick buy signals. Today it had trouble getting up through the 200 day moving average, but an indecisive trading day after a large bullish day as seen on Wednesday is not unexpected. The NASDAQ is giving more bullish tendencies. After coming up through the 200 day moving average, it has used the 200 Ma  for support over the past few days. The NASDAQ is trading above the tee line. Although the upward trend may be very lethargic, as long as the indexes remain above the tee line the uptrend has to be considered in progress. This scenario has changed a couple of times over the past two weeks due to the dramatic oscillation of each trading day.

As witnessed at the end of April, when the markets start showing great indecision, that is the time to start watching for a trend reversal. This is time to start watching for bottoming signals in individual stock prices. A bullish candlestick signal needs to be followed by a close above the tee line. Remain nimble, meaning be prepared to get into positions and out of positions relatively quickly if investor sentiment dramatically reverses.

Commodity Options, Dow

DOW

Commodity Options, NASDAQ

NASDAQ

Because candlestick analysis is based primarily upon the high probability situations, the analysis of today’s market conditions indicate bottoming action and a high probability that an uptrend should be in progress. The magnitude of the uptrend is what will need to be watched. The next few days will give an indication of whether a strong uptrend is in progress or a sideways slowly moving uptrend is in progress. Fortunately, in either case, candlestick scanning capabilities allows for identifying which sectors/stocks will be performing the best.

Commodity Options, LULU

LULU

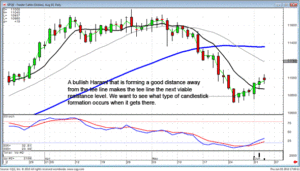
The T-line is a very important confirming indicator. However, it is often asked whether a position should be bought below the tee line. The answer to this question is a function of how far away prices have moved from the T-line. As seen in the August Feeder Cattle chart, a bullish Harami/Hammer signal formed well in the oversold area. Buying on the confirmation of that signal is more important if the price has moved a decent ways away from the tee line. The strategy becomes a little different. The important factor for when to buy or when to sell is based upon witnessing a candlestick reversal signal when stochastics are either in the overbought or oversold condition. The T-line is an excellent additional confirming indicator. However, when the price moves away from the T-line before reversing, the T-line now becomes the first area to watch to confirm whether an uptrend is in progress.

Commodity Options, Feeder Cattle

Feeder Cattle

As seen in the August feeder cattle chart, when the trading did come up to the T-line, it was evident there was not going to be resistance at that level. If you have been attending the free chat room training sessions on Thursday nights, you’ll often hear analysis that says, “Wait to see what the price does when it gets to the next moving average.” Waiting to see what it does at a specific moving average means seeing what type of formation  forms at that level. Candlestick signals are going to reveal whether investor sentiment was very decisive going through that moving average or whether an indecisive/sell signal formed once it got to the projected target. This information is extremely useful when establishing trades below the T-line.

Chat session tonight 8 PM ET – We will be looking at which sectors should be coming out of this bottoming action with the best strength. Remember, Tina Logan will be presenting next Thursday June 10th.

Good Investing,

The Candlestick Forum Team


Current Website Specials

July 2010

2-Day- Training Webinars 

Candlestick Technical Analysis Webinar – July 10 & 11

 Options Training Webinar – July 31st & August 1st

Click here for details

Website special reflects current newsletter. If you are reading an archived newsletter you will be directed to Current Website Special.

Candlestick Signals Can Eliminate the Fear of Stock Market Crashes

Stock market crashes – forewarned by candlestick signals.

Stock market crashes are the major fear of most investors. The “what if” scenario. What if I am fully invested and the stock market crashes. Fortunately that fear can be eliminated with candlestick signals. Most investors have the fear of stock market crashes such as we saw in 1929. There have been some substantial stock market crashes in the past 20 years. These stock market crashes had a different result. The general public were the ones trying to get in at the bottoms while the institutional investors were bailing out, trying to save their investment record.

Stock market crashes do not necessarily need to be feared. Using candlesticks signals, all stock market crashes are foretold by candlestick signals. Stock market crashes do not occur unexpectedly. The stock market crash of 1929, which had its major selling occur in October, actually started selling off in August. The stock market crashes in the past 20 years revealed definite candlestick sell signals prior to the big selling day’s. These stock market crashes should not be feared. A candlestick investor, utilizing the signals, can be prepared by not only being out of long positions, but short positions can be put in place. Having the ability to identify what the market trends are doing will eliminate an investor’s apprehension about a possible market crash.

The major advantage of candlestick signals is that they identify investor sentiment in a market trend. The stock market crashes usually occur at the end of those sustained downtrends. The big selling days do not occur as a surprise. Not only to the candlestick signals reduce the apprehension about being in the stock market, they allow an investor to be positioned in the stock market either long or short to take advantage of the current trends.

Market direction

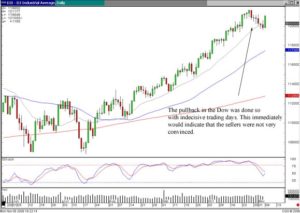
The over all trends of the markets can be easier to evaluate when using the candlestick signals. As seen in the current Dow chart, the Dow appears to be in an uptrend. The past few weeks have revealed a pullback. The same type of pullback that appeared in late February into early March. The trend channel can easily be seen. The conditions of the stochastics are also easily recognized. Monday, the Dow formed a strong Inverted Hammer signal, with the stochastics getting close to the oversold condition. What should happen to confirm an Inverted Hammer signal with stochastics getting near the oversold condition? A bullish day the next day. This would confirm the signal as well as conforming with the uptrending movements of the Dow.

Stock Market Crashes Identified, DOW
DOW

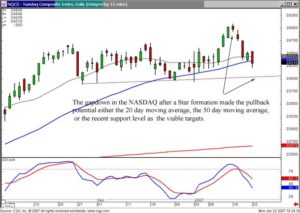
The NASDAQ is showing sell signals. A Doji, followed by a Spinning Top, followed by a Bearish Engulfing signal with stochastics starting to curl down reveals a possible pullback in that index. What formations are forming in the NASDAQ? A Fry Pan Bottom! Will the Fry Pan Bottom formation be violated with a few days of a pullback? Definitely not. Also, the stochastics do not reveal any dramatically over bought condition.

Stock Market Crash, NASDAQ

NASDAQ

The NASDAQ  pulling  back for the next few days and the Dow picking up strength over the next few days would be the exact opposite of what has occurred in these indexes over the past week or so. This would be more confirmation that the markets are in slow uptrends. As one is selling off, the other is picking up strength. This indicates that there is not any massive selling. The sectors are just rotating.

The portfolio should be predominantly long but anticipate moving from sectors that are topping out into sectors that are picking up strength.

Short Term Stock Trading

Short term stock trading, also known as day trading, is the practice of buying and selling financial instruments within the same trading day on the stock market. Typically all positions are closed before the market close on each trading day. Short term stock trading allows the investors to buy stock and sell shock throughout the day. The goal is to make a quick profit within seconds that day traders own stock, through the rising or falling of the value of stock. Day trading can be risky business and is only intended for the educated investor. There are two techniques that day traders use to make a profit including leveraging and selling short.

Leveraging, when short term stock trading, is the process of borrowing money to make money without changing or increasing the performance of the trade. Leveraging is very risky investing strategy because if the investment goes against the investor, the loss is much greater. The profit is much greater as well! Leveraging increase both gains and losses so the investor must be prepared to pay back not only what he lost, but also what he borrowed if trade does not go as planned. Leveraging allows for more people to trade stock and requires the investor to open a margin account. Margin is leverage and a margin account is offered by brokerage firms allowing investors to borrow money and to use securities as collateral. Once the margin account is opened, when short term stock trading, the trader can borrow up to 50% of the purchase price of a stock. Margin is a great thing when investments are going up in value, but it can be devastating for new investors who are less experienced.

Short term stock trading, requires the use of stop loss strategies when trading on margin. Stop loss orders provide a measure of protection to the investor. Basically a stop loss order is an order to sell a security at the market price once it hits a predetermined level. Investors are urged to implement simple stop loss strategies to prevent from losing big on a trade. Some may not necessarily implement stop loss in their trading system, but they may choose to set a mental stop loss for themselves. This is okay to do; however, a lot of investors have a problem with actually carrying out the stop loss if it not set up in their system. Investors who do not want to implement a stop loss into their trading system must be disciplined enough to actually follow through with the stop loss they have mentally prepared for.

Another method used in short term stock trading is selling short. Day traders that sell short actually borrow a security and then sell it in attempts to pay back the loan. They pay back the loan by buying cheaper shares later on. Day trading is a very exciting way to make money investing in stock however it is also very risky business. For those interested in this type of investing, it is very important that you know exactly what you are doing before you begin to day trade.

Good investing,

The Candlestick Forum Team


This Week Only!!

If you’ve been thinking about joining – now is the time!
The lowest membership rate of the year.
$97 monthly rate slashed by over 25% when you enroll as an annual subscriber.

And if you Act now, I’ll include an extra 30-days FREE.
 That’s 13 months for $907, less than $70 per month!
Double Bonus to the first 50 people to join -Receive an  Additional $225 in Training Products – “Trading Rules to Successful Profits”, “Setting Entry & Exit Points” and ‘Stop Loss Strategies & Techniques”
Website special reflects current newsletter. If you are reading an archived newsletter you will be directed to the Current Website Special.

Candlestick Signals For Day Trading Oil

Over the past year and a half, the most volatile commodity traded has been oil. After rising to record highs at over $75 a barrel in 2006, the prices dropped below $50 and then began rising again. While such volatility can be dangerous for the investor, it also presents great opportunities for profit to the successful traders that know what to do and where to look when using signals for day trading oil.

It has been stated that 80% of all futures trades end in failure. The question behind this statistic is “why?” Commodities can be difficult to predict and there is a lot of volatility but what is the underlying reason for so much failure? Commodities trading require the proficient use of a good trading and investing system which can point out signals for day trading oil and many people simply don’t use a good system.

This is where the Japanese Candlesticks method enters the picture. Colder than normal weather….warmer than normal weather. Calm in the Middle East….war in the Middle East. These are the types of things that can drive oil prices drastically up or down. It is crucial to correctly interpret signals for day trading oil. It takes discipline to study the charts and perform technical analysis, and Japanese Candlestick signals are at the heart of the perfect search.
Technical analysis is the assumption that current prices are representative of the sum of all known information concerning the markets. The price of a stock not only reflects clinical facts, but it also represents the emotions and the “feelings” of a particular moment. Profit-taking, skepticism, greed and fear are all tangible factors when dealing with the markets because the markets can move based on emotions as well as facts. An expert in the market tries to remove the emotion factor from all decisions and base decisions on the candlestick chart formations, assuming that the prices reflect all variables.

The question at this juncture is how to use candlestick signals for day trading oil futures. A simple bar chart can follow the open and close of a particular type of oil; what it can not do is help you to see the signals for day trading oil. The main factors of candlestick chart patterns can be applied to align the elements of successful option trades; signals, stochastics, market direction, etc. A few simple processes can be employed that will exploit the same factors that make other option investors lose money to put money into your pocket.

These factors are:

Direction

As you learn candlestick signals for day trading oil, you will notice that you are more accurately able to assess the trends in the market. When all the essential indicators line up for a successful option trade, the signal showing strong commodity trading, the stochastics below the 20 line, further confirmed by a bounce off a trend line, and overall market direction, etc., the best option trading system can be executed. If you are able to successfully read the absolute bottom signals, your signals for day trading oil just got a lot more profitable!

Magnitude

Understanding the signals for day trading oil also means being able to understand the potential magnitude of the price move. The status of the stochastics should indicate how long the upside move can potentially be maintained. The analysis of the upside is going to dictate the ultimate trade strategy. And this has to incorporate the final signal?.time.

Time

Time is a misunderstood component in the signals for day trading oil. You might be saying to yourself, ?I?m going to move today?s purchases tomorrow, how could time even be a factor?? Signals for day trading oil will focus less on the time between buying and selling and focus more on where you are in a particular movement. Remember, you want to buy at the absolute bottom and sell at the top of a cycle; anything else and you?re taking money from your own pocket. Because of this, candlestick signals are still a strong ally to day trading. By understanding the patterns, signals for day trading oil can be much more profitable as you find the extremes in a movement. Candlestick option trading programs have been developed to make “high” risk trading into a very low risk procedure.

Stock Fundamental Analysis – A Key Component For Success

When it comes to investing in the stock market, one measurement stands out above the rest; how much did the investor earn at the bottom line. Traders use many tools to help determine their stock trading plan, but the best tool for assisting an investor is basic stock fundamental analysis. Stock fundamental analysis is the process of examining businesses at the most essential levels. This method of review evaluates key risk reward ratios of a business to attempt to determine the stability and financial health of a company and to determine the value of its stock.

Many investors use stock fundamental analysis alone for their determination of future stock purchases. While stock fundamental analysis is a powerful practice, it should be an important part of an investor’s overall stock trading plan. This plan should include stop loss strategies, as well as a stock trading system such as Japanese Candlesticks. Such a trading system, coupled with basic fundamental analysis can provide the trader with a valuable insight into the murky waters of the stock market.

Basic fundamental analysis helps an investor to know how much money a company earns. This is the ultimate measurement of its success, both currently and in the future. Earnings can be difficult to calculate, but that is to be expected when dealing with the stock market. When a company is growing and profitable, its stock generally increases; earnings create higher stock prices and in some cases, regular dividends and successful trading. Lower stock value can have the opposite effect, making the market bearish on the stock. By evaluating a stock with stock fundamental analysis, it is possible to look for basic candlestick chart formations and determine the direction of a stock. When the direction is known, an investor can implement stock market strategies which reflect either a bullish or bearish approach.

In addition to understanding a company’s earnings, there are a number of ratios involved in basic fundamental analysis that help the investors to evaluate the worth of a company’s stock. These ratios focus on earnings, growth and value in the market. Evaluating these dynamics together can provide unique reflections on the value of the company. When a company can be identified by basic fundamental analysis, its stock can be tracked using candlestick chart analysis. With this information, an investor can move confidently to make a trade. 
Stock fundamental analysis is a key component in any trading plan. Investors can find patterns and trends in the stock price history and use this information to help make decisions about a company’s value and the value of its stock. Incorporating a stock trading system such as Japanese Candlesticks teams up with stock fundamental analysis to form a powerful team in evaluating stock.

The bottom line is the ultimate measure of the success of an investor. Using basic fundamental and technical analysis, a stock trading plan and a stock investing system, an investor increases the possibility of moving from the hope of being a good trader to the reality of becoming a highly successful trader.

Scalping Commodity Profits

The legal way of scalping commodity profits is to look for many small gains during the trading day. In scalping commodity profits traders can make money in either a moving or a quiet commodity market. Simply using the bid/ask spread the trader can make money always buying at the bid price and selling at the ask price in a quiet market. This is also known as spread trading. When the market moves the trader will buy and sell taking small profits throughout the day. Because the market will fluctuate as it moves the scalper will also take losses. Because there is a cost of trading, commissions and fees, it is important for the trader to keep close track of his or her trades to make sure that the overhead of scalping commodity profits does not eat up all profits. A good way to understand scalping in the commodities markets or elsewhere is to take commodity and futures training. The ability to predict market movement with technical analysis tools such as Candlestick chart analysis and Candlestick trading tactics will help the trader in scalping for profits.

The three basic tenets of scalping commodity profits or scalping in any market are these. The shorter the time you are in the market the less your risk. Small moves in the market are more common than larger ones. The nature of the market is that smaller moves are tied to trading whereas larger moves require a change in market fundamentals. Whether the trader is essentially doing arbitrage on small gaps created by the bid ask spread or taking advantage of the irregularity of a market advance, he or she will rely upon technical analysis to make profits. This is not a world of fundamental analysis of commodity futures or commodity options. It is the very attentive watching of the commodities market and the taking of small profits when they are available. This is a very business like approach to trading that can make money every day.

Something important to remember is that the other meaning of scalping is illegal market manipulation. This kind of scalping is when an broker or other insider purchases a security for his or her own account and then promptly recommends it for long term investment. When the equity price goes up the scalper immediately sells and pockets the profit. This is illegal and, when found out, is prosecuted by the SEC. On the contrary scalping by taking advantage of changes in market liquidity, market direction, and progressively widening bid ask prices as the market will allow is perfectly legal and potentially very profitable. The use of Candlestick basics to help determine the direction of individual commodities is essential in the process of scalping commodity profits.

A nice aspect in trading commodities by scalping is that the trader does not have to wait for a major movement in the market as might be the case with trading options in the commodity market or stock market. As it is just a possible to scalp for profits in a quiet market as a moving market the trader can take a lunch break without fearing that he or she will miss a great commodity market opportunity. A degree of market inefficiency is embedded in the bid ask spread. For many traders with the patience and diligence required, this is enough to profit nicely in scalping commodity profits. Trading mini waves in the market that last less than a minute the commodity trader can take advantage of brief commodity prices changes before they disappear. By staying in the market ever so briefly this sort of trading, of course, requires a familiarity with commodity trading software to keep up the minute if not the second.


Market Direction

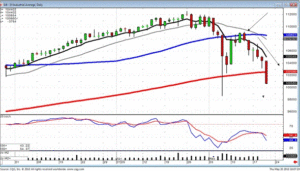
Why were we able to make big profits this past week on the short side? Having the knowledge of how price patterns perform! The Dow has formed a Blue Ice Failure pattern. This pattern was named by Dave Elliott of Wall Street teachers. ( We will try to get him back on a Thursday night chat very soon ) a blue ice failure pattern has very simple parameters. Once a price comes down through a potential support level, the price will try to come back up through that support level. If it fails, it will go down to the next support level. This was evident when we saw a Bearish Harami in the Dow, forming at the 50 day moving average. That became an indicator to start shorting with confidence.

Many investors have problems with when to enter a trade as well as when to take profits. If the analysis of a pattern can easily project the next viable target, that should be a place to take profits. That does not necessarily mean completely closing out a portfolio but at least taking part of the positions off at those levels. Why is that? If a pattern has a projected target, such as witnessed in the Blue Ice Failure of the Dow, that means the target has been hit enough times in the past to make it a very high probability level to be watched. If that is the case, once that target is reached, there will be the probabilities of people taking profits. Take some profits yourself. However, be aware of what type of signal is forming at that support level. As demonstrated in today’s trading, the Dow did not slow down at the 200 day moving average, it went right through. This makes the remaining portfolio still short but now looking for the next potential reversal area.

Scalping Commodity Profits, Dow

DOW

If there is not a another identifiable support level, what becomes the next criteria for when to close out short positions? The next candlestick reversal signal. Obviously the price trend will be in the oversold condition. Learning candlestick reversal signal appears, that is an indication the Bulls are starting to step in. This could be a good distance below the previous support level. That now makes that support level, in this case the 200 day moving average, the next upward target. Cover the short positions, go long but then watch to see what happens when everything comes back up to test that most recent support level.

When to take profits and when to honor your stop loss levels. That is a very difficult procedure for most investors. Emotions get intertwined very quickly. Take profits when the probabilities indicate it is time to take profits. We were short July wheat. There were a couple of days of indecisive trading. Today, wheat traded lower in sympathy with the equity markets. It was a good time to take profits when the price got back to the same levels it bottomed out previously.

Scalping Commodity Profits, Wheat

July Wheat

Scalping Commodity Profits, Wheat

July Wheat 5 min. Chart

It is the ability to visually recognize what is occurring at previous price points that greatly eliminates the emotions out of trading. This is especially true when trading commodities. Once you have learned how to master your emotions trading commodities, you can trade any market after that. Candlestick signals and patterns have simple trading rules. Those rules were established to take advantage of high probability situations. Once you can utilize the information built into candlestick signals, you would then be able to trade without fear and panic.

Commodity traders – do not miss this weekend’s Candlestick Forum Commodity Trading training – you will discover how to take the fear of volatile trading entities out of your thought process. Understanding how commodities move not only becomes an asset for trading them successfully, you also gain valuable evaluation information when trading commodity-based stocks. This is not rocket science! This is commonsense investment practices applied to trading entities that move with much more profitability with the same human emotions pushing the prices around. Please take time to look at trading commodities. It is knowledge that you will utilize for all aspects of investing successfully. Click here for more information.

Chat session tonight at 8 PM ET

The Candlestick Forum Team


This Week’s Special 

2-Day-Commodity Training

Webinar May 22-23, 2010

Click here for details

Website special reflects current newsletter. If you are reading an archived newsletter you will be directed to the Current Website Special.