Trading Stock Options

Trading stock options is very different from trading stocks. The main difference is that stocks give investors a small piece of ownership in the company, and options are contracts that give investors the right to buy stock or sell stock at a specific price by a specific date. When trading options, there are always two sides for every transaction that take place, including the buyer and the seller. This means that for every call or put option that is purchased, there is always another person selling it. When trading stock options, there are three choices for each investor. The investors can trade options, exercise the options and buy or sell the underlying security, or investors can use options as a hedge against a loss.

This article discusses how to do all of the above. First, when trading stock options the investor must understand that there are two pieces of information to take into consideration. It is important to understand that the price of the underlying stock directly affects the price of the option, therefore moving it up or down. It is also important to understand that the amount of time remaining on the option affects the price, meaning that as time runs out, the option becomes less attractive. For many investors, trading stock options means never taking possession of the underlying security. It is important to note as well that supply and demand also affect the option price.

When exercising the option, this means that the investor can take possession of or sell stock at the fixed price of the option without regard for the current market price of the stock. The investor must be sure to exercise that option before it expires, when options trading. Lastly, trading stock options as a hedge, allows the investor to use options as insurance against a loss if the investor if worried about a stock price dropping.

The other option to hedging is to implement a stop-loss order with your broker so that you can sell the stock if it falls below a certain point. Trading stock options is seen by investors as a very risky way to make money. It can be tricky because even those stocks that seem to continue to rise very quickly can suddenly drop. That being said, there is always the possibility of total loss, when simply stock trading. The important lesson to learn is that you must educate yourself and know that you will lose from time to time. Many investors suggest that you should only plan to lose money that you can afford to lose.

They suggest that if you can lose only 20% of you account at a time when trading stock options, then you should use no more than 20% of your account on any single stock options trade. Like all types of investing you must proceed with caution if you are a beginner. Trading stock options is a very complicated form of investing and is one that you can lose your money in very quickly if you don’t know what you are doing. Good investing, The Candlestick Forum Team
Stock Market Investing Software Is Not Required with Candlestick Analysis

Stock market investing software is constantly searched for. Everybody wants a stock market investing software that will solve their investment problems. Unfortunately, there is not a stock market investing software that will solve investment problems. Candlestick signals provide the information needed for extracting consistent profits out of the markets. If you learn how to use candlestick signals effectively, you will not need to depend on any stock market investing software ever again. The information conveyed in candlestick signals allows an investor to evaluate all markets and all market conditions. Most stock market investing software works well in specific market conditions but not in others.

Analyzing what the signals reveal creates a foundation for understanding what market trends are doing at any given time. Having the ability to mentally anticipate what the signals are revealing for the future is a much stronger investment format than depending on stock market investing software. The candlestick signals revealed in the Dow, in this recent market trend, has allowed investors to partake in some very strong stock moves. Having the ability to anticipate what should occur after a candlestick signal, produces opportunities to take profits at the best times or to continue holding a position when a confirmation signal does not occur. Evaluating what to do based upon the candlestick signals is  the application of common sense. What should occur after a candlestick reversal signal? Knowing that information permits an investor to close out a trade or not close out a trade, whichever is indicated after the signal occurs.

Analyzing the patterns and the potential targets that a price should produce becomes much more accurate when utilizing the signals. What should occur in an uptrend when an overbought condition reveals a candlestick sell signal? Confirmation of the sellers taking over. What should be construed if there is no selling confirmation? That the trend is still in existence. Using some very simple techniques in candlestick analysis keeps an investor from closing out a position too early. Non-confirmation of a candlestick signal reveals as much important information as confirmation of that signal. If you learn the 12 major signals, and what should occur upon seeing those signals, then an investor’s investment abilities become dramatically enhanced. Click here for the 12 major signals package now available in quick download.

When to take profits – One of the huge benefits provided by candlestick signals is illustrating very simple stop loss techniques. These stop loss techniques can help an investor take profits at the logical areas. One of the biggest problems for most investors is knowing when it is time to sell. The candlestick signals allow for some simple stop loss techniques. As illustrated in the ERS chart, the price had moved dramatically over the past few months. When would be time to sell? The same question is asked when a stock price is heading straight down. When is it time to buy?  The same rationale is applied for either question.

One simple technique can be applied to an uptrending stock. When does the exuberant buying appear in a stock price? When you get near the top. What illustrates the exuberant buying is coming in? Witnessing gap up in price in the overbought conditions. One simple stop loss technique when seeing a gap up in price in an overbought condition is to put your stop at levels that would indicate a high probability that a candlestick sell signal could form. For example, if  price gaps up in the overbought area and continues to go higher, put your stop loss at the open price. If it gaps up in price and immediately starts selling off, put your stop loss at the previous day’s close. The rationale for these levels would be that if the price came back down through those levels, there is a high probability that a candlestick sell signal can occur. Even if the price came down through those levels and then went back up, the probability of a doji or a hanging man signal could occur.

Best Investment Advice

When reading articles on trading websites and in an occasional investment newsletter, you see it over and over. Subscribers are looking for that one “fantasy” stock pick that will make a $500 investment turn into enough money to make them wealthy. Others say they have a fool poof investing system, except that when you test it for yourself, you find that it only works in a bullish market. And why aren’t there as many day trading/investing systems around now as in the late 1990’s?

What is rare though, are investors who actually have an investment plan based on solid stock investing concepts. A precise set of rules telling them when they should buy, how long they should hold, and where to place their stop loss. This is what separates the successful investors from the rest. How much should an investment strategy like this cost? Only a few minutes of your time!

It’s not difficult to let your emotions get in the way of your stock market investing strategy. Happiness results when our research pays off with a profit, and sadness and frustration occur when we go against our own logic and place that sell order. We’ve all been there. Unfortunately, we’ve done that quite a bit. It’s important to remember that the best investment strategy is to preserve capital. It makes sense when you read it, but how many times have you watched a minimal loss turn into a much more significant loss just because your instinct told you it would move higher?

And how many times did you turn the loss incurred above into an even greater loss? A 50% loss means you have to acquire a 100% gain just to break even. While the world of penny stock investing supplies opportunities, few of them will give you a 100%. With medium to large cap investing, it takes a lengthy period of time with a successful company to get that 100% return. Stop turning your small losses into larger ones by not adhering to your stock trading plan. What should you include in your best investment plan?

1. Starting capital. It’s important to become familiar with how much money you are putting at risk on a typical day. It’s a possibility that you could invest in a business, and find out later that day that its shares are being delisted. Just because you invest a few thousand dollars at the beginning of the day, doesn’t mean you will have the equivalent sum at the end of the day. Set limits based on an amount you are comfortable with. Preserve capital.

2. How much money are you prepared to lose per trade? Successful investors ask themselves this before they invest. For example, if $1000 is an acceptable amount for you to lose today, it becomes easier to determine where your stop loss should be.

3. Where is your stop loss? Are you setting your stop loss based on share price? Are you setting your stop loss based on the total amount you are prepared to lose today? Are you setting your stop loss based on a percentage of the trade or a percentage of your trading capital? Do you have a plan for a trailing stop loss?

4. Entries – at what point do you enter a trade? Is it based on a price? Do you try to time the bottom of a trend? Are you placing a buy stop to take advantage of momentum? Did you hear exciting news about a particular company this morning? Did you find something of interest in one of your stock market newsletters?

5. Did you sleep well last night? If you’re having a lousy day and wished you would never have gotten out of bed? Don’t starting trading in a bad mood and lose all of yesterday’s gains!

Small Cap Stocks – Are The Rewards Worth The Risks?

For anyone that remembers the old days of television cartoons, the image flashed through your mind when you read the title. Wile E. Coyote is running along, looking for his supper, when he is blown off the road by the speedy Road Runner. It is hard to imagine turning that analogy into a discussion of the stock market, but that’s exactly what we are going to do.

Small-capitalization companies, also known as small-cap stocks, are the stock market’s version of the Road Runner. While there are small-cap stocks that are in stock sectors that make them slower than large-caps, these companies generally are the ones that usually make Wall Street news for their explosive earnings that create double-digit returns for their investors.

Where are the little guys and are they big spenders?

There are several market indexes that track small-cap stocks, most notably the Russell 2000 and the Standard & Poor’s 600. While you can search for small-cap stocks on these indexes, the general rule is that a company is considered a small-cap stock if its market value is below $1 billion.

As a rule, small-cap stocks represent companies with similarly small revenues. Typically these are companies that are just starting out or they are in a position to expand their markets. For example, in 2004 the hamburger restaurant Red Robin experienced a 100% increase in both its stock price and its market value, the latter climbing to $780 million. Because it was small, the company was able to grow much faster than its large-cap cousin, McDonalds, which “only” saw a 27% increase. It remains to be seen what Red Robin will do in the future, but performance like their 2004 results would be an incredible asset to your stock portfolio.

Are small-cap stocks worth the pain?

Now we will have a quick stock market lesson; one of the basic stock investing concepts is that where there is great reward, there will likely be great risk accompanying it. This is true of small-cap stocks. The companies can rapidly climb the ladder of success but they can also fall off of it and take the investor with them. Small-cap stocks experience much more stock volatility than their large-cap cousins and because of this, they are far more risky.
In addition, small-cap stocks tend to suffer more during economic hard times than large or mid-caps because as investors sense a downturn in the market, they tend to rely on the blue-chips, or large-caps, to weather the difficult times. This alone makes them less appealing to those who are long term investing.

And now for the good news!

There is a positive spin to the risk of small-cap stocks. Unless you are only looking for long-term investments, small-caps can be a valuable part of your portfolio diversification. While you should follow your trading plan and use a stock trading system like Japanese Candlesticks, if you add small-cap stocks as one portion of your portfolio, you can enjoy their rapid growth and profitability without losing everything on one bad investment.

In addition, young investors who have time to be more aggressive with their savings should find small-cap stocks to be an excellent way to increase the value of their portfolio. It is still important to emphasize the need for fundamental and technical analysis even in the early days of investing. Why lose a small fortune in the beginning when you don’t need to do it? With due diligence, everyone can benefit from out-running Wiley Coyote with small-cap stocks!

Exchange Traded Funds

Exchange traded funds offer a very wide range of investment opportunities and they represent the shares of ownership in either unit investment trusts or in depository receipts. Depository receipts hold the portfolios of common stocks that track the performance and the dividend yields of specific market indexes. Exchange traded funds, also known as ETFs, are like closed-end and open-end index mutual funds and they trade like stocks.  They provide the investor with the opportunity to buy and sell a selection of stocks in a single security, just like when selling or buying stocks per share. Exchange traded funds are actually traded on an exchange, such as the NYSE, instead of being directly purchased from the issuing company, like mutual funds.   Exchange traded funds offer a very easy way to diversify a small investment and they have many benefits over mutual fund investing.

Benefits of Exchange Traded Funds vs. Mutual Funds

  • There is no minimum investment other than the market price of one share for ETFs.  Mutual funds often have a minimum of investment of $2,500 making portfolio diversification difficult for new investors.
  • Exchange traded funds typically have lower fees than traditional mutual funds. There is no redemption fee required at liquidation and the commission charged to buy or sell stock is similar to that of a stock trade.  Index funds are also no-load and are commission free.
  • Tax efficient.  The structure of exchange traded funds gives the investor a tax advantage over mutual funds.  Since they are traded on an exchange, the ETF investor sells to other investors and there is no underlying security that is sold. There are also no capital gains that are distributed.  Mutual funds however, must sell underlying securities upon redemption, and the capital gains are distributed to the owners of the funds.  This can result in taxable gains and losses that are passed on to the investor when investing in mutual funds.
  • Faster liquidation of a position for exchange traded funds.  They also allow the ability to set a limit order allowing for flexibly trading that a mutual fund could not offer. They can also be more liquid that the individual shares that they hold and more specifically for an ETF that holds small cap stocks that are thinly traded, or bonds other than U.S. Treasuries.
  • Pricing. The purchase and selling of exchange traded funds happen at market prices instead of end-of-day net asset value, used by mutual funds. They can be continuously priced throughout the day allowing the investor to react to open market conditions on an intraday basis. As result an ETF can be purchased at a premium or at a discount to the value of the underlying assets

Exchange traded funds provide small investors with more choices and they also force the investor to conduct more research on markets that they previously had no experience in. They also enable those individuals who are working to build a strong portfolio through diversification, to invest smaller amounts of money at first.  If you are interested in ETFs continue to do research and learn about the ins and outs of investing in these types of funds.

Mutual Funds

Mutual funds are companies that pool money from many investors and invest the money in stocks, bonds, short-term money-market instruments, into other assets or securities, or a combination of each of these investments. They have a fund manager who is responsible for investing the pooled money into specific securities, and they provide the ability for investors to purchase stocks and bonds with much lower trading costs than if they tried to do it on their own. When you are investing in mutual funds, you are buying shares and you become a shareholder.
Investing in this type of fund provides many advantages over stock investing. These advantages are explained below.

Diversification

This is the number one advantage and allows investors to purchase a large number of stocks. Mutual fund investing provides you with portfolio diversification and it greatly reduces your risk.

Liquidity

The investor is able to receive money produced from this type of investment in a relatively short period of time. Income generated from stocks and bonds can be difficult to obtain and CD’s offer no liquidity at all.

Cost

Small amounts of money can be invested at no trading cost.  Investors can also invest at regular intervals and receive the same manager, access and investment, as the wealthy stock brokers since mutual funds are non-discriminatory.

Professional Management

With this type of fund you hire a professional manager who researches and trades the market on a regular basis. They are fairly inexpensive and they usually have a support staff devoted to them as well.
While there are many advantages, there are also disadvantages as well.  A few disadvantages are explained below.

In the Dark

Investors have a hard time finding out the exact make-up of a fund’s portfolio at any given time. They also cannot influence which securities the fund manager buys and sells or the timing of the trades.

Guaranteed Costs

While there are typically no trading costs, investors must still play sales charges, annual fees, and other expenses despite the performance of the fund. They may also have to pay taxes on any capital gains received even if the fund did not perform well.

Uncertainty in Price

Unlike investing in stocks where you can get real-time pricing information, mutual funds only calculate their NAV (net asset value per share) once a day and this typically takes place after the stock exchange closes. The fund unfortunately may not be calculated until many hours after you have placed your order.

Obviously there is much more information that you should know before you begin to invest in mutual funds. The advantages far out way the disadvantages and almost every successful investor will tell you that you need to invest in mutual funds in order to build a strong portfolio. You may also want to learn about topics such as asset allocation, hedge fund investing, and stock charting. These are additional investing concepts that may be of interest to you as well. Happy investing and good luck!

Large Cap Stocks – Running With The Big Dogs

Market value is a term that is used frequently in the financial world and Wall Street news. This is a snapshot of the overall value of a company. To figure market value, you multiply the number of outstanding shares the company has by the price per share. For example, a company that has 10 million shares of stock and their price is $10 per share, the market value of the company is $100 million.

How big is big?

Large capitalization companies, or large cap stocks as they are known, are by far the biggest players in the stock market. “How big”, you ask? A market value of $5 billion generally qualifies a company for large cap stock status. At the top end are companies like Wal-Mart with $197 billion, Microsoft with $291 billion and ExxonMobil leads the way at $419 billion. If you look at the entire group of large cap stocks, they account for 72% of the entire market, showing exactly how dominant these companies really are!

Large cap stocks also have a huge role in pushing the economy, and in turn they garner much attention. The two best known market indexes, the Dow Jones Industrial Average and the Standard & Poor’s 500, are both made up of large-cap stocks.

The impact of large-cap stocks on the economy

Why are these large cap stocks so important? Each one of these companies is like a huge ocean liner; even in rough waters a large ship is hard to capsize. The same is true for these companies; what they lack in speed they make up in size. Classic blue chip stocks have a continuous flow of revenue, steady earnings and consistent dividends. Since they are so large, they tend to be unaffected by rough economic times. These large cap stocks appear in so many stock portfolios because they are stabilizing, defensive investments, neither growing too rapidly nor falling too dramatically based on the stock market news reports of the day.

Non-traditional and Pseudo Large Cap Stocks

The 1990’s unleashed a new phenomenon on the stock market. Companies were achieving large cap stock status at incredible rates, some even before they actually earned it. While companies like Microsoft and Intel exploded onto the scene other companies kind of snuck in; at one time Price line was valued at more than $23 billion before it came tumbling down like other Internet stocks. At the start of 2007, Price line had a market value of around $1.6 billion.

The large cap stock lesson of the 1990’s is that while some of these non-traditional large cap stocks were able to actually reach and maintain their status, the pseudo large cap stocks we exposed as over-valued small cap stocks or mid-caps. As with most stock market movers, these companies found there true position as their market values were truly determined.

Large cap stocks and their risk vs. reward

Large cap stocks tend to resist being viewed as speculative stocks; in fact many of them are considered perfect for defensive investing because of their immense size, their history of consistency and tendency to pay dividends. They do experience their ups and downs, but large cap stocks are not normally victims of the of the stock volatility that their smaller siblings experience.

Role of large-cap stock in a stock portfolio

Because they bring so many positives to the table, large-cap stocks are a valuable part of any portfolio diversification. These stocks provide stability and long-term protection.  Although they are not usually big gainers, large-cap stocks can provide the portfolio stability so that investors can add other speculative stocks for their increased earnings potential. Large-cap stocks can give any investor the security of running with the big dogs!

Candlestick Analysis Stock Market Investing Made Easy

Stock market investing becomes much easier when an investor can evaluate the direction of a market. Trends can be projected by the Candlestick signals and the market patterns that have occurred over and over in the past. Understanding what the Candlestick signals illustrate becomes a valuable tool. Familiarization with the psychology that forms the signals helps one understand what the next trading trend will be.

Stock market investing should be done with an accountable trading platform. The accountability is required for analyzing the probabilities of being correct. An investor, who is investing in the stock market or any other market, that does not maintain an investment strategy will never produce consistent returns. Investing without a trading program never allows an investor to analyze when to exit a trade. Also, it does not allow an investor to improve upon their stock market investing when trades don’t work. Candlesticks charts make this process much easier.

Candlestick signals provide a format for investors to get into trades where the probabilities are in their favor. Utilizing the Candlestick signals for entry and exit strategies also provides an investor with very simple stop loss procedures.
The fact that a Candlestick buy signal is formed by a reoccurring set of Candlestick formations permits an investor to utilize visual statistical analysis. The 12 major reversal signals would not be in existence today if they did not work an extremely high percentage of the time. Use these basic assumptions to your advantage.

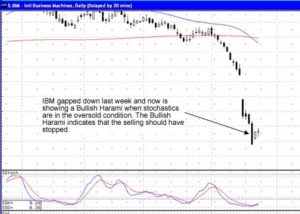
IBM is a prime example. This week it formed a Bullish Harami. The stochastics are in an oversold condition. The stock price gapped down the prior week with stochastics in the oversold area. This was an alert to start watching for a Candlestick buy signal. The Bullish Harami on Thursday resulted in continued buying, in a weak market, on Friday. This provides a format for trading IBM. If it shows more strength on Monday, the Bullish Harami will have provided a signal that the selling had stopped. This is not rocket science. These are observations that have worked successfully for the past few centuries.

Candlestick Analysis, IBM
IBM

Bullish Harami

BULLISH HARAMI

Description

The Harami is an often seen formation. The pattern is composed of a two candle formation in a down-trending market. The body of the first candle is the same color as the current trend. The first body of the pattern is a long body, the second body is smaller. The open and the close occur inside the open and the close of the previous day. Its presence indicates that the trend is over.

The Japanese definition for Harami is pregnant woman or body within. The first candle is black, a continuation of the existing trend. The second candle, the little belly sticking out, is usually white, but that is not always the case (see the Homing Pigeon signal). The location and size of the second candle will influence the magnitude of the reversal.

Criteria

  • The body of the first candle is black, the body of the second candle is white.
  • The downtrend has been evident for a good period. A long black candle occurs at the end of the trend.
  • The second day opens higher than the close of the previous day and closes lower than the open of the prior day.
  • Unlike the Western “Inside Day”, just the body needs to remain in the previous day’s body, where as the “Inside Day” requires both the body and the shadows to remain inside the previous day’s body.
  • For a reversal signal, further confirmation is required to indicate that the trend is now moving up.

Signal Enhancements

The longer the black candle and the white candle, the more forceful the reversal.
The higher the white candle closes up on the black candle, the more convincing that a reversal has occurred despite the size of the white candle.

Pattern Psychology

After a strong downtrend has been in effect and after a selling day, the bulls open the price higher than the previous close. The shorts get concerned and start covering. The price finishes higher for the day. This is enough support to have the short sellers take notice that the trend has been violated. A strong day after that would convince everybody that the trend was reversing. Usually the volume is above the recent norm due to the unwinding of short positions.

Market Direction

The Dow showed some strong bottoming action this past week. Monday, there was a Spinning Top, confirmed with some buying on Tuesday. Wednesday, there was a Bearish Engulfing signal. A Bearish Engulfing signal at the bottom has a different meaning than a Bearish Engulfing signal appearing when the stochastics are in the overbought area. A Bearish Engulfing signal at the bottom is usually the last gasp selling. It acts as a forewarning to start looking for a Candlestick buy signal. That buy signal came on Thursday as a strong Bullish Engulfing signal.
Thursday, there was the strongest bullish trading day that the Dow has experienced in a couple of years. After that strong bullish signal, the selling on Friday may not be much to be concerned about. It is not unusual after a sustained downtrend to see a follow-through day of selling after a Candlestick buy signal. What will be important to see on Monday is more buying coming into the markets.

That leaves two definite scenarios to be watched for. A weak day on Monday, closing back down near the low end of Thursday’s Bullish Engulfing signal would reveal that the bears were still in control of the trend. That would instigate closing any remaining long positions.

Stock Screening with Candlestick Signals

Stock screening simplified with candlestick signals Successful stock screening is the goal for the technical investor. The ultimate stock screening program is one that can go through 9,900 trading entities every day to find the best potential trades. This process should be done quickly and efficiently.  The primary attribute of candlestick signals is the ability of  stock screening for the best trades each day in the matter of minutes. Candlestick signals reveal where buying and selling is occurring right now. Most investors do not have access or can not afford large research capabilities. It is impossible to set up a stock screening program that can follow occurrences in every sector/stock. Japanese Rice traders utilized the information built into candlestick signals to accomplish one major facet of investing, learning where the money was moving to and from.

Candlestick signals  identify where  investors are becoming interested in future potential. Utilizing the 12 major candlestick signals allows an investor to quickly pin point where sentiment is  dramatically changing. This can be a bullish identification or a bearish identification. The ability to visually recognize new strengths or weaknesses coming into a trend becomes an extremely powerful investment tool.  Fortunately learning to recognize the 12 major signals is a very easy process.  Better yet, knowing what investor sentiment  created the signal develops very strong insights into why prices move. Click here for details on  this weeks 12 CD training special.

Using formulas  to identify candlestick signals makes stock screening very simple  for the technical trader; candlestick signals make finding correct trades a very logical process.  The signals have proven themselves for hundreds of years. Recognizing reversal signals allows an investor to participate in historically proven  high profit situations.  For the fundamental investor, the candlestick signals are a stock screening alert system.  It brings attention to the stocks or sectors that are now being recognized by the smart money.  For those investors that do not have access to large research sources, the signals become the stimulus to concentrate research capabilities into the  stocks or sectors that have now shown a change of investor sentiment. Being able to recognize a major reversal signal becomes the impetus to research the reasons why that stock/sector is now gaining interest.

Stock Charting The Common Thread of Great Businesses

All great businesses have it, that special feature that sets them apart from the competition. Whether it is the ability to introduce new products fastest, that name or slogan that people can’t forget, or that company that grabs the market share by the throat and won’t let go, stock charting successful businesses will show successful traders that most excellent businesses have specific traits in common. Or to phrase it a different way, there are important stock charting factors that separate a good stock from an ordinary stock. Among these factors, several of the non-financial characteristics that you can consider when stock charting successful businesses are product lines, competitive advantages and market leadership. Without these traits, it is highly unlikely that a company will be able to sustain any kind of leadership position.

Product Lines

When stock charting successful businesses, it is important to look at their picture from a long term investing perspective. Will anyone want, or even remember, the company’s product tomorrow? If a company’s source of identity is based on something that is a fad or quickly passing technology, the company’s success will fade as fast as its product. 8-track tape players were top-of-the-line technology at one time, but you will probably only find a player in a museum these days. Great companies with success you can track using candlestick charting have products and services that people desire year after year because of their universal appeal or because the company keeps the products fresh by responding to changing consumer demands.

Competitive Advantage

Competitive advantages, often called the “deep moat”, protect great companies from their competitors and allow them to chart a successful business course that translates to the stock market. Such advantages can be high costs of entry, such as in heavy manufacturing or brand recognition like McDonald’s, Coca Cola or Wal-Mart. These types of advantages make it difficult for competitors to grab market share, and at the same time easy to conduct stock charting on the success of these businesses. Dell Computer’s well-organized operations let it build personal computers cheaper than its competitors. Dell was able to grab and hold on to positive stock market results and significant market share. Southwest Airlines is another company that did the same things as its competitors, but did it cheaper and better, carving out a solid piece of the highly competitive airline business with a work ethic that successful businesses love to chart.

Market Leadership

Market leadership is undoubtedly a stock charting characteristic of a successful company. Stock market movers are in the position to largely dictate the agenda and direction for their entire industry. General Motors dictated the direction of the automotive industry for fifty years on the strength of their position as the number one car maker in the world. Unfortunately, the downside of this position is that everyone is trying to knock off number one and with one mistake or sluggish response; others can begin to chip away at this position and create struggling stocks. GM is the perfect example of this situation as well with Toyota poised to move into the number one position.

Conclusion

Stock charting of highly successful businesses is easy due to their common characteristics. Chartable success will usually follow any successful business because the factors appear in the stock market. A successful trader can use these signals of successful businesses in combination with his or her stock trading plan and stock trading system to identify potential purchases. Japanese Candlesticks is a powerful stock investing system that will help any investor conduct stock charting of successful businesses. With a centuries-old record of accomplishment, a trader can truly identify successful companies and include them in a profitable portfolio.