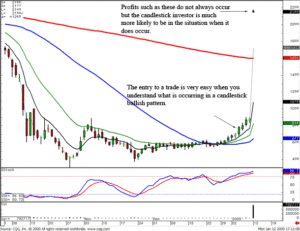
Stock Market News – Do You Take Advantage Of This?

Following stock market news can be a great source of information for the successful trader. Whether gleaning facts or anticipating emotional responses by other investors, it is possible to garner a great deal of information from stock market newsletters and from both the print and network media outlets.

For example, the stock market news was buzzing on October 27, 2006 when the US Commerce Department announced that the economy was at its slowest pace in over three years, spurring speculation that the comfortable landing many had desired might not be found. Investors forced up the price of stocks in October, speculating that the economy was entering a slow period. The theory was that a gradual leveling wouldn’t affect corporate profits or consumer spending. A gradual slowdown is desirable to protect the economy from the threat of inflation and to encourage the Federal Reserve to lower short-term interest rates. Technical analysis of the stock market news led investors to believe that the report on the GDP (the broadest measure of the economy) would show slowing growth, but the report confirmed the belief that the sluggish housing market might affect other areas of the economy. The 1.6 percent growth rate was below the expected 2.1 percent forecast, fueled mainly by the lethargic housing market.

While the stock market news seemed to affect the greed and fear of the investors, some experts viewed the downturn as an indication of profit-taking and consolidation. The news of the stock market adjustment was the perfect opportunity for some traders to take a deep breath after the recent run and review their portfolio diversification. While trading was down for both the Dow Jones and NASDAQ stock exchanges, their totals were still up, further indicating a temporary adjustment and not a major downturn.

Such movements are valuable when learning about the stock market. For a beginner investing in the stock market, it is important to differentiate between technical facts and emotional trading. While stock technical analysis changes only if information on a particular company or its stock changes, emotional trading can be affected by a stock market report on the news. Even a skilled trader can be moved by such sensational news, so it is imperative that a beginner be wary. It is possible for a trader, using a stock trading plan and a stock trading system, to avoid being lured into reacting only to news about the stock market.

stock investing system is crucial because it prevents a trader from becoming emotionally invested in the stock market news. This system should include stop loss strategies and techniques which aid the trader in decision making when a stock is faltering. In addition, a stock trading system implements technical analysis, keeping the investor focused on the factual side of trading and not on which member of the stock market is making news.  Using a system such as Japanese Candlesticks, even a beginning investor can be certain that he, or she, is prepared to act analytically even when the stock market news is bad.
Defensive Investing – A Game Plan For Success

In sports, the general strategy is that teams should play defensively because a good defense wins games. It is commonly believed that a defensive approach opens up offensive opportunities. Transposed to the stock market, Benjamin Graham, the “Dean of the Stock Market” wrote a book nearly seventy years ago on defensive investing that is still must-read material for investors. Defensive investing helps traders through not only the good times but also on days like Black Monday.

Black Monday occurred on October 19, 1987. In just a couple of weeks, the stock markets plummeted 30% including a 508 point drop on Black Monday. To understand its severity, on September 17, 2001, the market only experienced a 7% drop for the first post-9/11 day of trading. Both events were bad, but they hold valuable lessons for successful traders today.

A drastic fall like either of these can make even the most grounded investor consider jumping hastily to sell assets. Defensive investing requires that an investor understand his or her stock portfolio and search it for vulnerability. After that, fundamental analysis is key because understanding the stability of the market and your stocks makes you less exposed to such extreme stock volatility. Understanding defensive investing helps an investor to be prepared for bad times in the market.

Is that all you can expect from defensive investing? Absolutely not! Remember that in sports, a good defensive can open up offensive opportunities. Get ready for some offense here! Traders that do not follow their stock trading plans open themselves up to emotional reactions from greed and fear. When investors dump a company’s stock, the stock prices fall because of the sell-off. This creates incredible opportunities for others to purchase stocks well below their actual market value. When the slide ends and the market stabilizes, these defensive investors are in for very handsome returns on their investments.

Defensive investing also fits very well with a stock trading system like Japanese Candlesticks. Since the emphasis in defensive investing relies on long term investing, you need stocks that are more conservative and follow very dependable trends. Technical analysis with Candlesticks allows you to see exactly where your stocks have been and gives you a very good idea of the track in the immediately future. Such a system allows investors to move very confidently in both good times and in bad times.

Because Japanese Candlesticks is a powerful stock charting tool, it can help an investor find a subtle trend that indicates which way a stock will move. Used as part of an overall stock trading plan, Candlesticks can provide the type of analysis needed to find conservative stock trends and help traders to invest defensively.
One thing is sure about the stock market; nothing is sure. Everyday there are twists and turns that that can attempt to lead a trader away from his or her trading plan. A defensive investment plan will keep your investment secure and allow you to go on the offensive at just the right time. If used correctly, this investment philosophy will help you to “win” in the stock market.

Developing A Trading Plan

The key component to any successful trading is the existence of a good trading plan. For the beginner investing in the stock market, the obvious question is; what is a trading plan and how do I establish a good one? The definition of a trading plan would be a process for evaluating stocks, identifying risk and profit objectives, and planning a long term investing strategy. In addition, a good trading plan will also include defining a trading system such as Japanese Candlesticks. While realizing that even the best trading plan isn’t perfect, most successful traders maintain that the discipline to follow their plan contributed to their success more than their investment philosophy. They know that the proof of a good plan is its results.

Adding to the success of a trading plan are the trading tools, specifically technical analysis tools. When you join technical analysis with a system such as candlestick chart analysis, you can be assured that your trading plan contains the components necessary to establish profitability in the market.

With all of this power available, an investor must still be able to recognize when they have made investing mistakes and be able to recover. A good trading plan will include stop loss strategies and techniques allowing an investor to have a pre-prepared plan in the event that a particular investment goes bad. Preparing for just such a situation can be the difference between success in the market and complete failure.

Another important concept in a trading plan is portfolio diversification. A portfolio that has a broad variety of investment options, varying levels of risk, and diverse profit potential can be an excellent way to insulate an investment. This way, it’s possible to speculate on a stock and use the rest of the portfolio as a hedge against a devastating loss.

What part does the investor play in a trading plan? The investor is the centerpiece and most important part of every successful, or unsuccessful, trading plan! The market is as much a mental adventure as it is anything, with euphoria, boredom, joy, pain, greed and fear, all attempting to shake an investor away from following his or her trading plan. A trader that can withstand the emotions of the market and stick to the trading plan will have the best chance at success. As with most things in life, emotional reactions when investing almost always lead to bad decisions. Avoiding investing in unknown markets and resisting the temptation to begin investing in the stock market because of boredom or peer pressure are good lessons to learn in order to avoid potential problems.

It is true that investing definitely has its share of pitfalls and a good stock trading plan goes a long way to assisting any investor who wishes to enjoy profitable trading in the market. When beginning to invest in the stock market, it is critical to take the time to develop a trading plan, acquire the necessary tools to correctly evaluate companies and their financial situations, and to take advantage of learning from the people who have gone through it all before. While the market can be unpredictable, the principles and techniques needed to be successful have been used for years and have been shown to be quite reliable. A well thought-out plan and the lessons learned by others will provide the best investing advice and investor can ever receive.

Investing In The Stock Market With Candlestick Signals

Investing in the stock market requires having a trading program that has accountability. Most investors, when invested in the stock market, do not have any program. They buy stocks based on a multitude of investment input. The problem with this approach is that there is no program for when to get in and when to get out. Investing in the stock market requires a trading format that can be analyzed after both good and bad trades.

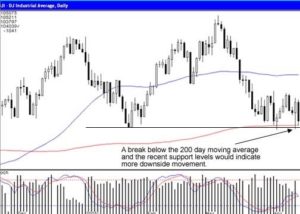
Most investors don’t have an exit strategy for a trade that does work and especially for a trade that does not work. The lack of that information makes investing in the stock market more hit or miss. Using the analysis of Candlestick signals allows an investor to quickly interpret what a price action or a trend is going to do. Once this analysis has been made, price movement that deviates from that analysis can be quickly analyzed viewing the Candlestick signals. The prime example occurred on Tuesday as the Dow came back down and tested the 200 day moving average. The bullish signal that formed late in the day in both the Dow and the NASDAQ would have prepared investors to start buying upon seeing confirming buying on Wednesday. Using candlestick charts make the analysis very easy.

However, the consolidation in the morning could have been expected after a big reversal day. The fact that the sellers came in and pushed the markets back down to the 200 day moving average at the end of the day creates a completely different scenario than if the Bulls had sustained the uptrend on Wednesday. The weakness in both the NASDAQ and the Dow require a new analysis.

With the NASDAQ trading near its recent lows and the Dow trading right near the 200 day moving average, and with the Dow once again forming a Bearish Engulfing signal makes for a different evaluation. Two weeks ago, a Bearish Engulfing signal in an oversold condition meant to look for a buy signal. The Bearish Engulfing signal on Wednesday formed when the stochastics were not in the oversold condition any more.

This makes the new analysis fairly simple. Further weakness on Thursday, taking prices down through the 200 day moving average in the Dow and heading to new lower levels in the NASDAQ, while stochastics are turning back down, would indicate that more selling will probably come into this market. On the other hand, a positive trading day, such as a Bullish Harami or a Doji-type day would provide more evidence that the 200 day moving average was going to act as support.

Investing In The Stock Market With Candlestick Signals

Dow

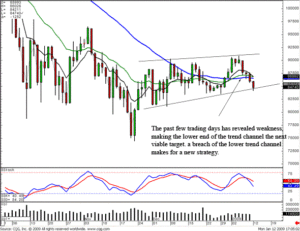
Having the Candlestick signals to make an evaluation and using other simple technical indicators provide the Candlestick investor with a much easier view of what investors’ intentions are. Thursday’s trading needs to see strength above the 200 day moving average to consider holding on to any long positions.


Related Articles
Long Term Investing – Effective Long Term Investing With Candlestick Charting
Online Trading Easier with Candlestick Signals

Trading Rules to Successful Profits – Profitable Trading Rules

Whether your passion is sports, stock car racing, or the stock market, there are “rules of the trade” that control everything. Albert Pujols can’t hit a baseball into foul territory and expect to be awarded a home run. Tony Stewart can’t drive the opposite direction of the other drivers in a NASCAR race and expect to be given the trophy. And successful traders can’t ignore the trading rules established long before they began to trade and expect to have a profitable trading career. While the trading rules of the stock market are relatively simple, they provide the framework for all traders.

Emotional Trading

Emotional trading needs to be understood, and controlled, by the trader. Hope, greed and fear are emotions, not stock market strategies. While it is important to understand emotional trading from the aspect of its effect on other traders, it cannot be part of the trading rules. Trading is a psychological game; the market is not “against the trader”, only the trader’s emotions are an opponent.

It is important to remember that losses are the result of taking risks. Risk reward ratios are concepts that are important trading rules; admitting losses early and learning from them will keep this ratio in a positive direction for the trader. The key is to accept the fact that losses will come and use your trading plan to minimize their impact. Also, it is important to realize that a missed opportunity doesn’t exist, and dwelling on stock market results outside of the investor’s portfolio creates undue pain. Realize that the market will create all of the opportunities that an investor can handle; it is important for an investor to learn from the trading rules, monitor his own performance, and learn from his, or her, investing mistakes.

Trading Plan

Some traders think that gambling with their portfolio is the cornerstone of their trading rules. Without a stock trading plan, stock technical analysis, or even a clue, they throw money at the market. Such an approach usually has disastrous results. An analytical approach can produce results that guessing and emotional trading can never duplicate. With a dedication to a trading plan and a stock trading system, a trader truly has the cornerstone of trading rules. What kinds of principles make a trading plan? Here are a few:

  • Never trade based on emotions. Have an established action plan and do not change these trading rules based on the events of any given day.
  • Establish and adhere to stop loss strategies and techniques. Even the best plan can miss and it’s important not to lose the entire portfolio over one loss. Stop loss strategies are not trading rules that add to the bottom line, but minimize losses there.
  • It is important to achieve portfolio diversification. A portfolio that is heavy in one or two stocks is vulnerable to heavy losses. It is wise to balance investments based on volatility, profitability, and stability.

Technical Analysis

Technical analysis is a systematic review of stocks and their movements. By understanding the dynamics of a company and charting its performance, an investor can attempt to discern a pattern for the movements of its stock. This trade rule is based on research and probabilities; it is the one tangible element in a largely unpredictable endeavor. Using understanding and a system such as technical analysis with Japanese Candlesticks, it is possible to find patterns and actually make sense of the stock market.

Conclusion

Above all, it is important to remember that the stock market is a business. With any business, a serious approach is crucial to reach the desired result. After learning the trading rules and perfecting the stock market strategies, it is important to do one more thing. Take a part of the profit as a reward. All of the hard work is in vane if it is not enjoyed. So when it is all finished, relax and enjoy that ball game or stock car race knowing that the trading rules have worked!

Trading And Investing – Do You Know The Difference?

Are You a Trader or an Investor?

Sounds like a confusing question, doesn’t it? Trading and investing are two terms that are used so interchangeably that it’s difficult to know the difference. In the language of the stock market, there is a big difference; and for those that confuse stock trading and long term investing, the difference can be painful.

There isn’t a big secret about the difference between the two. First, it is important to say that neither is bad nor wrong. Each is a different approach in a stock trading plan and the problem enters when someone starts out with one philosophy and switches to the other.

Let’s start with the difference between stock trading and investing long term in a company:

  • If you come to the conclusion that you should purchase a particular stock because of your technical analysis, you are trading stocks.
  • If you come to the conclusion that you should purchase stock because of your fundamental analysis of the company’s future prospects, you are long-term investing.
  • If you buy or sell stocks because of short-term movements in stock prices, you are trading stocks.
  • If you don’t sell struggling stocks because the outlook says “this is just a temporary downturn”, you are long-term investing.
  • If your only interest in companies is whether you should make a quick purchase or sale of hot stocks, you are trading stocks.
  • If your interest in a company is its impact on your stock portfolio, you are long-term investing.

Simply put, if you invest in stocks, you are a stock trader; if you invest in companies, you are a long-term investor. Again, neither of these philosophies is bad, both are looking for profit, just in different ways. The confusion between these two starts not when things are good, but when things get difficult. To make money investing in stock when things go bad, it is important to have stop loss strategies in place. Stock trading says to set a percent target and sell the stock if it reaches that level to minimize the loss. Long-term investing looks to first determine the reason for the fall, and then decide what the long-term impact on their portfolio is. If it outlook is bright, the investor will probably stay with the stock. If the future is bleak, it may be time to sell.

The problem is actually more of an emotional issue of greed and fear than anything. Since stock traders usually look at the daily trends and long-term investors focus on forecasts, making decisions outside of their expertise can be costly. If a stock trader decides to hold a struggling stock, he or she is less likely to understand the dynamics behind a downturn. If a long-term investor decides to quick-sell, he or she may miss the long-term implications by forsaking the investment philosophy.

Whether you choose to be a stock trader or a long-term investor, it is important to develop a solid stock trading system or stock investing system that coincides with your decisions and goals. Being a short-term trader or long-term investor is great, just be sure you know the difference
 

Investment Strategies – Shaping Your Future

It’s so easy to do, it will surprise you. The excitement of joining the world of investing, the opportunity to turn your $500 into millions, and the chance to impress your friends make it irresistible. You don’t know many stock market terms and you have no clue about a productive investment philosophy, but you are ready to go. Are you really? Even if you’re an investing veteran, it won’t hurt to refresh your memory. We’ll start with the basic types of investment strategies: growth investing, income investing and value investing.

Growth Investing

The name says it all; growth investment is the investment strategy of looking for the big winners in the stock market. Growth investors are looking for companies that traditionally have high growing earnings. In theory, high growth equals high stock prices and in turn, high profits. People involved in growth investing take their risks wagering that young, upcoming companies will break through and become leaders in their industry. When you think of this investment strategy, think Google. Google stock is a perfect example of a growth stock, as were many of the technology stocks in the 1990’s.

Many growth companies applicable to this investment strategy started with a dream, an idea and very little operating capital. They were able to overcome the obstacles and become strong profitable companies. Companies like this can achieve initial success but tend to be limited by capital. As they start attracting investors, the results can be very good. This investment strategy offers risk reward ratios that are quite drastic. While the rewards can be very high in growth investing, the risks are high as well.

Income Investing

Income investing is the most conservative and easy to understand investment strategy. Income investors target companies that consistently pay high stock dividends. This is a preferred stock market strategy for those around retirement age. This investment strategy looks for companies that tend to be large and well-established. There is always risk in stock market investing, but income investing is the most conservative investment strategy; in fact it is also known as defensive investing because it tends to protect the trader.

Value Investing

This investment strategy is a search for one thing; investors try to find stocks that have been overlooked by the rest of the market. While this doesn’t necessarily mean they are low priced stocks, it does mean that for whatever reason, the market has undervalued a particular stock. Many times, a stock gets overlooked while investors chase profits in another company in the same stock sector or a similar company that is perceived differently by investors. Technical analysis is important with such companies since an investor doesn’t want to confuse undervalued with under-performing. A value investor can look at the price/earnings ratio as one guide to the value of a stock. The hope of the value investor is that the market will recognize the worth of the company and its stock will be bid up to true value, realizing a profit for the trader.

Conclusion

These investment strategies are all beneficial to the successful investor. The significant difference between them is their level of risk. Part of formulating your trading plan is identifying your current risk tolerance. It is likely that a younger investor will have a greater tolerance for risk due to a greater time to make up for any losses, while an investor close to retirement might choose a conservative approach to make money yet better protect his or her investments.

Stock Price History and It’s Relationship to Overbought and Oversold Conditions

To see why stock price history tells successful traders when securities are oversold or overbought, we must first define the meanings of “oversold” and “overbought”. An oversold condition can be defined as the price where sellers will be replaced by more buyers who are hunting for bargains or looking for profit opportunities by buying securities when their prices bottom out. Overbought conditions occur at the price where buyers are replaced by sellers for a position in that stock. This is similar in theory to the economics concept of “supply and demand”.

When analyzing chart pattern reversals to better estimate price resistance and price support levels to help you exploit profit opportunities and to handle your trading decisions using stock price history, any stock chart profile can be reviewed. If you are buying and trading options, stripping dividends, writing covered calls, or even writing LEAPs, you can apply this regularly used information to your advantage.

So exactly what happens in the real world and how do the outcomes of stock price history translate to stock chart patterns as they relate to price points or plots?

A price level on a stock chart profile where we can expect an increase in the demand for a security, where the buyers take over as the weak sellers fold, is indicated by support (bottom price support). How do we know this? We know this by identifying the previously documented reaction to a price level in the chart’s stock price history. While learning how to read stock charts, we see that for any stock there are certain price levels where the selling pressure slows down or subsides, and the price trend shifts and reverses as stock price increases. We can assume, when this happens, that this price level will retain its significance when the price approaches that level again in the future.

It is important to note that all recorded plots at the end of the day represent the capital buying and selling net results of investors or institutions. Thus, it is very clear and factual. A bottoming price is known as the price support level, because the stock begins its recovery and the security’s price is supported at this level. Conversely, the overhead price resistance is the level where the security price has shown an inability to rise anymore, and a reversal to the downside can be expected. The best technical analysis tool to review for that price level is the RSI technical indicator.

Stock Volatility

When examining the stock chart patterns of hundreds of high quality, similarly profitable companies, you would notice that most move up and down regularly, if not predictably, with an upward long term bias, and that there is little, if any, similarity in the timing of the movements between the stocks themselves. This is the “stock volatility” that most people are afraid of and that Wall Street loves them to be afraid of.

It can encompass practically everything or be narrowly confined to certain sectors, it seems that either can be the case. The broader it becomes, the more likely it is to be classified as either a correction or a rally. Most of the time, there will be one or two of each in any particular year. This is considered normal in the stock market community. Don’t take it for granted when it goes up, and pay close attention to it when it goes down. Learn to live with stock volatility in the uncertain times, work with them in whatever direction they move, and you may eventually tame the beast!

It may come as a surprise, but it is this natural stock volatility, caused by hundreds of variables political, economic, natural, or human greed and fear, that is actually the only real “certainty” that exists in the financial markets.
Call it foresight or hindsight if you want to argue the point, but a view of fundamental and technical analysis in the longer term removes any guesswork and indicates fairly clearly a trading mentality that keys on the natural stock volatility of hundreds of equities. During corrections, consider these simple facts:

1) Don’t be in a rush to fill your portfolio, but if cash dries up before it’s over, you are doing it “correctly”.
2) Steep and fast corrections are better than the slow attrition variety.
3) Always accept even half your normal profit target while buying opportunities are plentiful.
4) When everything is down, don’t worry so much about the price of individual holdings.
5) Although the sellers outnumber the buyers, the buyers intend to make money on their purchases.

Volatile markets create opportunities with every trend change, but you have to be willing to buy or sell to get the benefits. It is necessary as a first step to realize that both “up” and “down” markets are forces with great potential. A proper attitude about the “down” markets will make one appreciate the “up” markets even more. Most stock market strategies demand answers to unanswerable questions, with an attempt to be in the right place at the right time.
Uncertainty regarding decision-making isn’t going to work. To be a successful trader, investment strategies require an understanding of the disciplined rules of portfolio and money management. Transitioning back to individual securities help you move toward your goals. Most of the time, the opportunities are out there. You just have to recognize them when you see them!

If you will learn to live with some new stock investing concepts for dealing with this investment game and its stock volatility, and can live in harmony with them for a few cycles, you will soon be buying good stocks, both old and new, at lower prices during corrections, and take reasonable profits on.

Psychology of Investing

The psychology of investing not only affects individual investors but also affects the market as a whole. Many investors often underestimate or are unaware of the affects that our emotions have on our return on investment. Many well educated and competent traders lose money due to trading anxiety and trading emotions. In today’s article we will discuss various emotions felt everyday by online stock investors and how each emotion affects trading decisions and trading performance.

The Psychology of Investing Emotions

Greed and Fear

Greed causes traders to buy at high prices or buy a large amount of the same share, therefore increasing risk. Fear causes investors to exit the markets too early causing a loss of otherwise attained profits. Traders suffering from fear are afraid that the price will decrease further so they get out before the timing is correct, instead of letting the trade play out.

Overconfidence

Traders who are overconfident tend to trade more rapidly and tend to overtrade. These traders lose money in commissions, taxes in addition to simply losing out on trades themselves due to the illusion of control. Greater participation in trading stock makes some traders feel more in control even though they are not. These traders also tend to invest in smaller and riskier companies and lack portfolio diversification.

Herding

The psychology of investing tells us that many investors tend to follow the crowd. They hear of hot stocks and they jump on the bandwagon only to lose money. What they fail to realize is that those stocks were hot until you and everyone else in “the herd” heard about them. Pass on these hot stock market picks. Even if they were money makers at some point, that time has passed. Find your own stocks to invest in based on your own proven research and analysis.

Confirmation Bias

Too often investors believe what they want to believe. We pay attention only to the information that supports what we believe, and ignore information that does not support what we “think we know.” Confirmation bias directly results in poor investment decisions and a loss of profits. An example of confirmation bias is when we become attached to a certain stock. Perhaps it performed very well in the past so we ignore all signs that it is currently not performing as well as it did and we invest anyway.

There are many factors to consider when studying the psychology of investing and how it affects stock traders everyday. Successful investors understand investment psychology and all it entails, they have determined their strengths and their weaknesses, and they proactively practice and develop the skills necessary to controlling their trading emotions so that they are successful in the stock market.

Learn more about Eliminating Emotions; The most profitable skill that can’t be taught!


Market Direction

“If this trading system works so well, why can’t I make money with it?” Have you ever asked yourself this question? It would seem logical that a proven trading technique should work for everybody all the time. What is the element that is different between somebody using a trading technique successfully and somebody else using the technique unsuccessfully? Emotions!

Being taught the mechanics of a successful trading program is fairly easy. Unfortunately, this education usually assumes investors will automatically implement the program based upon controlling their own emotions. Most trainings do not address this very important element of investing. Why? Because most investors want to hear how easy it is for them to make money with a new trading technique. They do not want to hear about the difficulties they will run into when utilizing any trading method.

A major facet of successful investing involves eliminating fear and greed from the decision-making process. This is the most difficult part of successful investing. Rational decision-making gets thrown out of the window when it comes to making investment decisions. Learning to control our emotions is the most difficult aspect of successful investing. We have to teach our own thought processes to respond completely different than the normal emotional reactions. Most investors do not even know they have to address this problem, let alone correct it.

Learning how to trade successfully is a two-part process. Implementing the correct executions based upon the information provided from your trading program and controlling your emotions while the trade is proceeding. Learning how to use candlestick analysis is easy. Learning to control your investment emotions becomes much easier when using candlestick signals correctly. The Candlestick Forum will be spending more time showing investors not only why and how candlestick analysis is profitable but also demonstrating what each investor needs to know about their own emotions to make investing successful. Look for the new e-book.

Does candlestick signals produce consistent profits? That may be a slightly different question than does candlestick signals consistently produce profits. Candlestick analysis is the proven investment technique that puts the probabilities of being in profitable trades in the investors favor. This does not necessarily mean the results are in a consistent style of return. It merely places an investors funds into situations where the probabilities are likely to produce a profit. This is why using a consistent money management system is important. Not every trade is going to work out as expected. There will be losses. However, based upon the results that candlestick signals have produced over the past 400 years, when all aspects of candlestick signals are in alignment, the total results should be a strong positive  return.

This has been  clearly illustrated in these market conditions. The morning and afternoon member commentary should have conveyed market conditions that are not overly bullish. Somewhat bearish as a matter of fact! But during the past few weeks, there have been excellent profits made by being in the correct sectors. The identification of these sectors were strictly due to the information illustrated from strong candlestick buy signals. The shipping sector and the mining sector have produced excellent profits over the past few weeks.

Psychology of Investing, Dow
DOW

Candlestick signals and patterns are created by investor sentiment. Candlestick price patterns reveal information that most investors overlook. Common sense! A bullish price pattern  developes for a certain reason. It becomes more pronounced when the general market conditions are bearish. Simple logic implies that if the general market trend is down and a price pattern in a specific stock is moving positive, buyers are entering that position with the knowledge the rest of the market is selling off. EYE is a perfect example of utilizing a price pattern, a Fry Pan bottom. This candlestick pattern clearly illustrates bullish sentiment coming into the stock price. This was occurring when the Dow could clearly be seen as in a negative trend. The Candlestick Forum recommended this position based upon what the pattern was revealing. Was there any knowledge that a buyout bid was in the making? Definitely not! Unless any of us have an extensive research department to monitor each and every opportunity in the market, the best strategy is to use a trading technique that reveals what other investors are doing, Candlesticks!

Pscyhology of Investing, EYE
EYE

EYE produced better than 150% return in a three-day period. Obviously, this does not happen all the time. The important fact is that the candlestick signals/patterns allowed for the analysis of the possibility of a big price move. Having the good fortune of being in the right place at the right time is a result of the probabilities created by these patterns. It does not take a large number of situations such as this to produce a much better return annually than other trading programs.

Learn how to use candlestick signals correctly. The proper use of money management and emotional control produces a much greater potential result than any other trading program available.

Chat session tonight for members 8 PM ET.

Good investing,
The Candlestick Forum Team


Online Training Sessions with Stephen Bigalow

Now Scheduling for

January 24th & 25th, 2009
Click here for details

Group size is limited; Sessions fill quickly – Pre-register early


This Week’s Special – NEW RELEASE!

Stephen Bigalow’s latest ebook on Eliminating Emotions retail price of $129 reduced to $69 for our Introductory Special Price to Newsletter Subscribers

Click here for more details

Website special reflects current newsletter. If you are reading an archived newsletter you will be directed to Current Website Special.