Archives for October 2019

Daily Stock Market Reports – FREE MARKET COMMENTS

Daily Stock Market Comments

Get Your FREE Daily Stock Market Report.

Read Mr. Bigalow’s market comments every day to know where the stock market is heading!


Steve’s Trading Diary

The information in this section contains the unedited thoughts and musings of a professional Candlestick trading expert, Steve Bigalow,  as he goes about his daily Candlestick analysis in search of great trades.

The follow-ups on the daily stock picks displayed here are limited to only the closed or unexecuted trades for previous months. To see the current follow-ups on the open trades, you must be a member of the Candlestick Trading Forum’s paid subscription service.

Sell Strangle – Neutral Options Trading Strategy

A savvy, experienced investor has a money making plan for any condition in the stock market. Whether the market is stable or volatile, whether it is bullish or bearish, there is a method for finding a profit. Such is the case with a Sell Strangle. This technique requires the investor to sell a Call Option that is out-of-the-money as well as a Put Option that is also out-of-the-money; both the Call Option and the Put Option need to be on the same stock with the same expiration date. This strategy is very similar to a Sell Straddle but with a Sell Strangle, the strike prices are not the same.

A Sell Strangle is made when the market has experienced a substantial upward move and your expectation is for consolidation. In this case, the possible results are a known, limited gain or unlimited risk. A Sell Strangle isn’t a move for the beginner investing in the stock market since the risk to reward ratio is not positive and extreme care with this maneuver is required.

The gain in a Sell Strangle is only the premium that is received for selling the call option and the put option. Remember, as with any stock transaction, your profit is reduced by any commissions. Done as a response to a dramatic upward move that has occurred, the investor is expecting the market to experience a consolidation and absorb its gains before moving again. Since the market is filled with extreme stock volatility, the cost of the Call and Put Options will tend to be very high. When the market does consolidate, volatility will decrease and lower the price of the options, allowing the investor to buy back the options at a lower price to close the position. With a Sell Strangle, the concept of time decay also works to the advantage of the investor. While this is a somewhat complex transaction, a Sell Strangle is an excellent stock option trading strategy for an experienced trader.

A Sell Strangle requires that the investor monitor the position for unfavorable movement and, if necessary, buy back one of the options if there is any indication that the market will resume its trend or reverse direction. If there is an indication that the market will resume its upward trend, the trader should buy back the call; if the market appears to be heading down, the trader should buy back the put.

It is important that the trader do stock market technical analysis prior to implementing this strategy. The powerful charting capabilities of this stock investing system will offer insight into movements in the market before attempting to enter a Sell Strangle. By using a stock market trading system like Japanese Candlesticks, a trader can not only identify the mood of the market, but identify a stock that is a candidate for a trade like a Sell Strangle.

While a Sell Strangle isn’t advisable for everyone, it is one of several investment options that can create profits for a skilled trader. Using a tested stock trading plan, good technical analysis tools, and a system such as Japanese Candlesticks, a trader will find this method to be something that not only creates a profit, but adds another weapon to the arsenal of successful traders.


Return to main Options Trading Category

Stock Market Advice for Trading The Morning Star Signal

Stock market advice is plentiful over the internet. There is sage stock market advice like; Don’t try to time the market, use cost averaging, diversify, and limitless tid-bits but they do not teach you anything about trading. What good is stock market advice if you still don’t know how to read a stock chart? The Candlestick Forum provides practical stock market advice by continued “How To Trade” articles for identifying specific candlestick charts. This article will help you to identify The Morning Star signal and the trading criteria used for successful implementation. We hope these articles are helping you along your way to successful stock market trading. Be sure to join Stephen Bigalow live over the internet for his free Thursday evening Chat Sessions.

Morning Star

MORNING STAR

Description

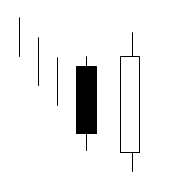
The Morning Star is a bottom reversal signal. Like the planet Mercury, the morning star, it foretells that brighter things – sunrise, is about to occur, or that prices are going to go higher. It is formed after an obvious downtrend. It is made by a long black body, usually one of the fear-induces days at the bottom of a long decline. The following day gaps down. However, the magnitude of the trading range remains small for the day. This is the star of the formation. The third day is a white candle day. And represents the fact that the bulls have now stepped in and seized control. The optimal Morning Star signal would have a gap before and after the star day.

The make up of the star, an indecision formation, can consist of a number of candle formations. The important factor is to witness the confirmation of the bulls taking over the next day. That candle should consist of a closing that is at least halfway up the black candle of two days prior.

Criteria

  1. The downtrend has been apparent.
  2. The body of the first candle is black, continuing the current trend. The second candle is an indecision formation.
  3. The third day shows evidence that the bulls have stepped in. That candle should close at least halfway up the black candle.

Signal Enhancements

  1. The longer the black candle and the white candle, the more forceful the reversal.
  2. The more indecision that the star day illustrates, the better probabilities that a reversal will occur.
  3. A Gap between the first day and the second day adds to the probability that a reversal is occurring.
  4. A gap before and after the star day is even more desirable.
  5. The magnitude, that the third day comes up into the black candle of the first day, indicates the strength of the reversal.

Pattern Psychology

A strong downtrend has been in effect. The sellers start getting panicky. There is a large sell-off day. The next day as the selling continues, bulls are stepping in at the low prices. If there is big volume during these days, it shows that the ownership has dramatically changed hands. The second day does not have a large trading range. The third day the bears start to lose conviction as the bull increase their buying. When the price starts moving back into the trading range of the first day, the sellers diminish and the buyers seize control.

Training Tutorial

The Morning Star & Evening Star Signals  This 56 minute video provides a clear understanding for trading and maximizing your profits.

Technical Analysis of Stocks – Candlestick Analysis of Bad News Gaps

The ultimate poop trade! Technical analysis of stocks become much easier when able to interpret what investor sentiment is demonstrating. Candlestick analysis incorporates common sense investor concepts into graphic depictions. Understanding how to interpret what investor sentiment is doing after specific market movement will greatly enhance your profit potential.

The technical analysis of stocks present a multitude of price movements. A highly profitable opportunity is usually presented in bad news gap-downs. Consider the following situation. You just recently bought a position because of a very good bullish signal. All confirmation is positive, it moves up nicely the first day. THEN, the dreaded news; the company issues an earning warning, the SEC announces a surprise audit, a contract gets cancelled. Whatever the news, the price drops 20%, 30% or greater. The question is what to do now? Do you sell the stock, take a loss and move on? Do you trade it at the new levels? Do you hold and/or buy more at these levels? What is the best course of action?
Traders and long term investors will have completely different outlooks. The traders bought the stock a few days back due to specific parameters for making that trade. They should consider liquidating the trade immediately and move their money to better probabilities. The reason for putting on the trade, for a short term trade, has completely disappeared after the massive down-move. The longer term investor has a few more analytical options for gap analysis. They may want to hold the position because the Candlestick formations indicate that the price will move back up or liquidate because the Candlestick signal shows further decline. Reading the signals becomes an important element in knowing what to do in a “bad news” situation.

A “bad news” gap-down has a multitude of possibilities after the move. The prior trend gives you valuable information on how to react to the move. Of course, the news is going to be a surprise or there wouldn’t be the gap-down. Analyzing the trend prior to the move gives you a good idea of how much of a surprise the announcement or news bulletin is.

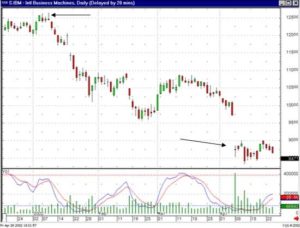
For example, IBM recently reported lower earning expectations. The price gapped down. However, you have to analyze whether this news was a complete surprise or whether the gradual decline in the stock price was the anticipation of the coming news. As can be seen in the IBM chart, the price had been declining for three months before the actual news was announced. The smart money was selling from the very top, months ahead of time. It was the die-hards that held on until the bad news was reported.

As the chart shows, the final gap-down produced a Long Legged Doji, massive indecision. From that point the buyers and the sellers have held the price relatively stable for the next few weeks. This now becomes one of the few times that a technical analysis has to revert back to fundamental input. Unless you believe that the markets in general are ready for a severe downtrend, consider what the chart is telling you. The price of IBM stock was reduced from $125.00 per share down to $87.00 per share. The last down-move produced a Doji. The price has not moved from that level for two weeks.

Bad News Gaps, IBM

IBM

Now, the fundamental input. IBM is a major U.S. company, well respected, and known to have excellent management personnel. And like any other quality company, it has made marketing or production mistakes from time to time through the years. The announcement that they made that knocked the price down, whether it was an earnings warning, shutting down a product line, or whatever, the factors that were announced as the result of the problem did not surprise company management. They knew that there were problems well before the news announcement. Being intelligent business people, the management of IBM was aware of the problems and had been working on the solutions months before they had to announce.

When the announcement was made, probably many strides had already been taken to correct whatever problems caused the price to drop. For the long term investor, it would not be unusual to see the price of IBM move back up to at least the level from where it last gapped down, at approximately $100. This still provides a 15% return.

You can chart your own course through common sense technical analysis of stocks. Watching for a Candlestick “buy” signal gives you the edge. IBM is not going out of business. Who was buying at these levels when everybody was selling? The smart money! Are the professional analysts of Wall Street recommending to buy at these levels? Probably not! But watch the price move from $85.00 back up to $95.00, then you will see the brave million dollar analysts say it is time to buy. Practical hands-on analysis, being able to see the “buy” signals for yourself, will keep you ahead of the crowd.

American Depositary Receipts

America depositary receipts (ADRs) represent ownership of shares of a non-United States company that trades in United States financial markets. Many foreign stocks trade on US stock exchanges as level II or III ADRs. Through the purchase of American Depositary Receipts US investors can buy shares of promising foreign companies without needing to change to foreign currencies, collect dividends in foreign currencies, and deal with a stock broker in a foreign language. Owners of American Depositary Receipts receive dividends in US dollars, buy and sell just like buying stock and selling stock of American companies. In addition traders can follow these foreign stocks with technical analysis tools such as Candlestick analysis just like they do with US stocks.

American Depositary Receipts are issued by one of four US depositary banks, the Bank of New York Mellon, Citibank, Deutsche Bank or JPMorgan. ADRs represent a share, multiple shares, or a part of a share of the foreign stock in question. The owner of an American Depositary Receipt can, in fact, request and receive the foreign stock that the ADR represents but that really defeats the purpose and ease of trading an ADR. The American Depositary Receipt tracks the price of the foreign stock in its home market, adjusting for currency rate variation. As an ADR represents a foreign stock both fundamental analysis of the foreign company and technical analysis of market pricing in the USA are valuable in trading these replacements for foreign stocks.

It is level II American depositary receipts that are typically traded on US stock exchanges. Unsponsored shares and level I ADR fs are traded over the counter. This is a convenient way for many foreign companies to have their stocks traded in the USA. However, foreign stocks below the level II cutoff have minimal reporting requirements and the trader or investor dealing in these has many of the same problems as with penny stocks investing on the OTC market. Level II ADR fs must meet SEC filing requirements and are delisted from stock exchanges if they fail to do so. Level III ADRfs are typically from companies that are raising capital in the USA by selling stock. They are subject to much more strict reporting requirements, similar to American companies. Thus those interested in trading ADR fs or interested in long term investing in foreign companies will be able to trade level II and III American Depositary Receipts on a US stock exchange.

Trading stocks through the use of American Depositary Receipts allows US citizens access to promising means of picking offshore investments. Level II and III ADR fs provide sufficient information for investors and traders to do adequate fundamental and technical analysis of these stocks. It will be possible to not only determine a foreign stock fs margin of safety and intrinsic stock value but to be able to follow profitably with Candlestick patterns as well. Application of Candlestick trading tactics is possible with ADR fs as well as other US based stocks trading on US exchanges.


Market Direction

Wednesday’s trading had the opportunity to break the upper trend channel. However, the hard selling on Wednesday brought the trading back into the middle of the descending trend channel. Today’s trading took the Dow down to test the lower end of the trend channel after testing the upper trend line yesterday. These market conditions make it relatively difficult to trade anything more than a day or so at a time.

June 11 and 12th – Two Day Candlestick Signal Training

Utilizing candlestick signals effectively dramatically improve one’s ability to analyze what the overall trend of the market is doing. Your trading abilities will greatly improve when you understand what investor sentiment is doing at particular times of a trend. Your profitability greatly improves by knowing when to enter trades and exit trades at the most appropriate candlestick results. Whether daytrading, swing trading, or long term investing, the knowledge built into candlestick signals, when interpreted correctly, allows an investor to analyze price movements in the same manner that seasoned professionals do.

Chat session tonight at 8 PM ET, Everyone is welcome!

The Candlestick Forum Team


Website Special

5 -Star Trading Package-Quick Download – 25%OFF!!

Website special reflects current newsletter. If you are reading an archived newsletter you will be directed to Current Website Special

Understanding the Stock Market Using Moving Averages and Candlesticks

The use of moving averages has become much more predominant with the advance of computer software. Moving averages can now be utilized up to the very minute of a trading chart. The automatic calculations for MA’s have greatly simplified their applications. Their use, along with Candlestick signals, makes understanding the stock market a much easier process. As with all other technical indicators, MA’s have a relevance when correlated to price movement. How the moving averages are utilized can make a big difference between moderate returns and highly profitable returns. When applying Candlestick signals with moving averages, understanding where the stock market indexes are likely to go becomes a higher probability evaluation.

There are many trading techniques using moving averages to provide entry and exit decisions. The most common use is when the relevant moving averages cross. The feasibility of using MA crossings apparently has some relevance or it would not be known as one of their useful aspects. However, the benefits of using moving averages become greatly diminished if that is the only application that is utilized. The accuracy of the crossing analysis is moderately successful. But there are many technical evaluations that are moderately successful.

Using Candlestick signals, along with the moving averages in a much different capacity, creates a trading program that produces highly profitable trades. The trades are also provided with a much greater frequency. The point of investing is to find processes for using technical indicators that provide a very high ratio of successful trades. Using the important moving averages as support and resistance areas, in conjunction with Candlestick analysis, advances the probabilities of participating in a correct trade. Fortunately, the use of the moving averages is very simple. Once applied to Candlestick charts, it makes the analysis of where a trend may support or resist a very simple visual process.

The 50-day moving average and the 200-day moving average are the important moving averages. There seems to be a great tendency for prices to support or resist at those averages. The 20-day moving average and the 80-day moving average are also important but would be considered secondary moving averages. Are there other moving averages that work effectively? Probably, but the moving averages mentioned above seem to have a statistical relevance for the past few years and will most likely continue to be relevant for the next few years.

Technical indicators provide important information. An indicator gains importance because of the reoccurring significance of major investment considerations happening at those points. This explanation is put forth so that each investor can become convinced in their own minds that moving averages, especially the ones being recommended in this chapter, have some relevance. Through the following chart evaluations and one’s own chart studying, the relevance of these signals should become apparent. This does not limit an investor from constantly being aware that other moving averages may start gaining importance in the eyes of other technical investors. The point of using these moving averages, along with Candlestick signals, is that historically many investors are watching to see what price movements do at these levels. The advantage of the Candlestick signals is that the signals tell you exactly what investors are doing at those levels.

Moving Averages as Support

When witnessing a downtrend, how do we tell when a bottom is getting near? As described in other chapters of my book, it could be when panic selling is witnessed coming into a price trend as the stochastics are getting toward the oversold area. That is a helpful alert but does not give us a roadmap to where that panic selling might end. Being able to utilize the 50-day moving average and the 200-day moving average as important support areas, those levels can at least be used as a target. Being able to evaluate the potential target that a trend may want to go to now makes the analysis of what is going on in the Candlestick formations that much easier to interpret. For example, if a sustained downtrend is now showing larger candles, the evidence that the panic bottom may be nearing and the price is approaching one of the major moving averages provides extra preparation for seeing what might occur at that moving average level. Panic selling, along with stochastics approaching the oversold area or being in the oversold area, and a major moving average approaching a level where a Candlestick buy signal has a probability of occurring, becomes a trade set up that an investor wants to start preparing for.

Do all charts work well with moving averages? Definitely not! However a large majority appear to. The purpose of Candlestick analysis is to provide an advantage for the investor to see what is happening at important technical levels. The Candlestick signals provide that clarity. If a chart is not providing patterns that make it easy to see what a price movement is going to do, then move on to another chart. There are many from which to choose, especially with the availability of easy-to-use computer scanning programs.

In putting all of the probabilities in favor of the investor, using every technical method can be enhanced when Candlestick signals are applied. How do you discover whether the major moving averages are a positive correlation with anticipating price moves? Easy! Investigate what has happened at those moving averages previously in the price trend. This can be done very quickly. All it takes is a quick visual analysis of what has happened in the past.

Commodity Options

Commodity options are a commonly used means of handling investment risk in trading commodity futures. By purchasing options contracts instead of directly purchasing futures contracts traders retain the right to buy or sell futures but have no obligation to do so. In using commodity options the trader will need to pay an option premium. However, the premium is the extent of his or her risk in options trading. In buying calls or buying puts in the commodities markets the trader can profit from a large shift in commodity prices but not suffer a loss if prices move in an unexpected direction. Traders selling puts and selling calls collect premiums in commodity options trading but also accept the risk of a large loss. Commodity and futures training will help the beginning trader get a handle of commodity options.

Commodity options are options on whether to buy or sell commodity futures. Commodity futures trading is contracting to buy or sell a standardized lot of a commodity at a future date. If the price of the commodity goes up or down substantially and in the desired direction the trader makes a handsome profit and if the commodity price moves adversely the loss can be devastating. By using commodity options the trader can buy a call or buy a put on a commodity futures contract. This will give him or her the right, but not the obligation, to buy or sell a commodity futures contract. If the trader believes that a commodity price is and will remain stable he or she may choose to sell puts or calls on the commodity. Providing that the price does remain stable the trader will gain the premium on each trade. Over the long term selling options is typically more profitable than buying. However, the trader needs to be able to withstand an occasional substantial loss.

Whether the trader is dealing directly with commodity futures or chooses to trade commodity options it is important to have a clear sense of the range of possibilities the commodity in question will offer. This starts with the basic fundamentals and then moves on to the technical aspects of the commodity market. Both fundamental and technical analysis come into play as fundamental analysis will help predict the spot price of the commodity at contract expiration and technical analysis will help predict daily price movement of the futures contract. The trader is best served by doing his or her fundamental and technical analysis on the commodity in question well in advance of trading it. When the trader is quite certain in his or her belief that a commodity price will go up or down it may be best to simply buy or sell a futures contract. It is when there is some uncertainty involved that the trader will purchase and options contract. Then, if the desired price move occurs the commodity trader will execute the options contract and buy or sell the commodity futures contract. If the desired price movement does not occur he or she will simply swallow the price of the premium as a cost of doing business and not suffer a loss in direct commodity trading.


Market Direction

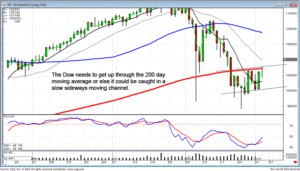
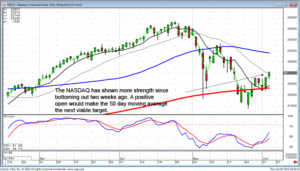
What is the market telling us? The Dow has been in the oversold condition and exhibiting candlestick buy signals. Today it had trouble getting up through the 200 day moving average, but an indecisive trading day after a large bullish day as seen on Wednesday is not unexpected. The NASDAQ is giving more bullish tendencies. After coming up through the 200 day moving average, it has used the 200 Ma  for support over the past few days. The NASDAQ is trading above the tee line. Although the upward trend may be very lethargic, as long as the indexes remain above the tee line the uptrend has to be considered in progress. This scenario has changed a couple of times over the past two weeks due to the dramatic oscillation of each trading day.

As witnessed at the end of April, when the markets start showing great indecision, that is the time to start watching for a trend reversal. This is time to start watching for bottoming signals in individual stock prices. A bullish candlestick signal needs to be followed by a close above the tee line. Remain nimble, meaning be prepared to get into positions and out of positions relatively quickly if investor sentiment dramatically reverses.

Commodity Options, Dow

DOW

Commodity Options, NASDAQ

NASDAQ

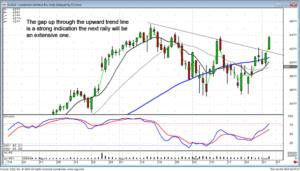
Because candlestick analysis is based primarily upon the high probability situations, the analysis of today’s market conditions indicate bottoming action and a high probability that an uptrend should be in progress. The magnitude of the uptrend is what will need to be watched. The next few days will give an indication of whether a strong uptrend is in progress or a sideways slowly moving uptrend is in progress. Fortunately, in either case, candlestick scanning capabilities allows for identifying which sectors/stocks will be performing the best.

Commodity Options, LULU

LULU

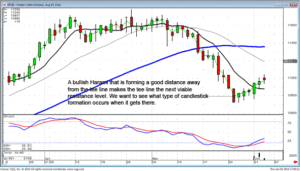
The T-line is a very important confirming indicator. However, it is often asked whether a position should be bought below the tee line. The answer to this question is a function of how far away prices have moved from the T-line. As seen in the August Feeder Cattle chart, a bullish Harami/Hammer signal formed well in the oversold area. Buying on the confirmation of that signal is more important if the price has moved a decent ways away from the tee line. The strategy becomes a little different. The important factor for when to buy or when to sell is based upon witnessing a candlestick reversal signal when stochastics are either in the overbought or oversold condition. The T-line is an excellent additional confirming indicator. However, when the price moves away from the T-line before reversing, the T-line now becomes the first area to watch to confirm whether an uptrend is in progress.

Commodity Options, Feeder Cattle

Feeder Cattle

As seen in the August feeder cattle chart, when the trading did come up to the T-line, it was evident there was not going to be resistance at that level. If you have been attending the free chat room training sessions on Thursday nights, you’ll often hear analysis that says, “Wait to see what the price does when it gets to the next moving average.” Waiting to see what it does at a specific moving average means seeing what type of formation  forms at that level. Candlestick signals are going to reveal whether investor sentiment was very decisive going through that moving average or whether an indecisive/sell signal formed once it got to the projected target. This information is extremely useful when establishing trades below the T-line.

Chat session tonight 8 PM ET – We will be looking at which sectors should be coming out of this bottoming action with the best strength. Remember, Tina Logan will be presenting next Thursday June 10th.

Good Investing,

The Candlestick Forum Team


Current Website Specials

July 2010

2-Day- Training Webinars 

Candlestick Technical Analysis Webinar – July 10 & 11

 Options Training Webinar – July 31st & August 1st

Click here for details

Website special reflects current newsletter. If you are reading an archived newsletter you will be directed to Current Website Special.

Put Hedge – Bearish Options Trading Strategy

A Put Hedge is the stock option trading strategy of buying puts during a bearish market to protect stock shares that, while the trader is reluctant to sell, are vulnerable to a decline in the market. Successful traders utilize strategies such as Put Hedges to insulate their portfolios from loss in a bearish market. This method also has the potential of unlimited profits, while at the same time limiting the potential loss by the investor.

When a trader is utilizing portfolio diversification and feels that the portfolio is exposed to a market decline, it is possible for the investor to have several options available to create a Put Hedge. An excellent technique, if the trader feels his, or her, portfolio is sufficiently diversified, is to purchase index puts to protect the entire portfolio. To implement a Put Hedge, the investor needs to select an index that best represents his / her portfolio. If the trader has successfully utilized his / her stock trading system, such as Japanese Candlesticks, and identified a declining market, any losses incurred with the decline in assets will, in turn, be offset by the gains made as the value of the index puts, or Put Hedges, experience an increase.

In such a stock market strategy, the profit reward has the potential to be unlimited, since both the traders’ portfolio and Put Hedge could rise instead of fall. In this instance, the investor would make money on the portfolio and the index puts minus the cost of the premium paid for the puts. If the stock market technical analysis of the trader is correct and the market declines, the losses on the established portfolio will be limited because they will be offset by the gains realized on the Put Hedges that were purchased. These puts, in turn, have been successful and the investor has created a Put Hedge which protected the trader’s portfolio in a bear market.

When the market turns or the investor once again has confidence in its stability, he / she can sell the index puts if the retain any value, giving the trader another avenue of profit. If the market index puts have expired, the trader will need to determine an appropriate course of action. If the market has truly turned, the investor can simply do nothing, since he / she no longer needs a Put Hedge to protect the stock portfolio. If the market is still bearish and unstable, the trader will need to determine whether it is necessary to purchase an additional Put Hedge as protection against the stock market. If so, the method for this transaction will be identical to the original purchase.

As with any strategy in the stock market, it is important to analyze the expectations for the underlying asset and for the market before proceeding. Remembering that this practice occurs during a bearish market, the investor must realize that any strategy should be conservative and consistent with his / her stock trading plan. Whether using Put Hedges or buying out-of-the-money calls, it is important that the investor understands that the ultimate goal is to make money, as well as to protect the money already made.


Return to main Options Trading Category

Candlestick Signals Can Eliminate the Fear of Stock Market Crashes

Stock market crashes – forewarned by candlestick signals.

Stock market crashes are the major fear of most investors. The “what if” scenario. What if I am fully invested and the stock market crashes. Fortunately that fear can be eliminated with candlestick signals. Most investors have the fear of stock market crashes such as we saw in 1929. There have been some substantial stock market crashes in the past 20 years. These stock market crashes had a different result. The general public were the ones trying to get in at the bottoms while the institutional investors were bailing out, trying to save their investment record.

Stock market crashes do not necessarily need to be feared. Using candlesticks signals, all stock market crashes are foretold by candlestick signals. Stock market crashes do not occur unexpectedly. The stock market crash of 1929, which had its major selling occur in October, actually started selling off in August. The stock market crashes in the past 20 years revealed definite candlestick sell signals prior to the big selling day’s. These stock market crashes should not be feared. A candlestick investor, utilizing the signals, can be prepared by not only being out of long positions, but short positions can be put in place. Having the ability to identify what the market trends are doing will eliminate an investor’s apprehension about a possible market crash.

The major advantage of candlestick signals is that they identify investor sentiment in a market trend. The stock market crashes usually occur at the end of those sustained downtrends. The big selling days do not occur as a surprise. Not only to the candlestick signals reduce the apprehension about being in the stock market, they allow an investor to be positioned in the stock market either long or short to take advantage of the current trends.

Market direction

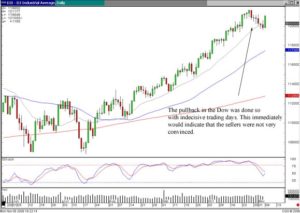
The over all trends of the markets can be easier to evaluate when using the candlestick signals. As seen in the current Dow chart, the Dow appears to be in an uptrend. The past few weeks have revealed a pullback. The same type of pullback that appeared in late February into early March. The trend channel can easily be seen. The conditions of the stochastics are also easily recognized. Monday, the Dow formed a strong Inverted Hammer signal, with the stochastics getting close to the oversold condition. What should happen to confirm an Inverted Hammer signal with stochastics getting near the oversold condition? A bullish day the next day. This would confirm the signal as well as conforming with the uptrending movements of the Dow.

Stock Market Crashes Identified, DOW
DOW

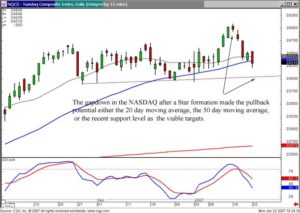
The NASDAQ is showing sell signals. A Doji, followed by a Spinning Top, followed by a Bearish Engulfing signal with stochastics starting to curl down reveals a possible pullback in that index. What formations are forming in the NASDAQ? A Fry Pan Bottom! Will the Fry Pan Bottom formation be violated with a few days of a pullback? Definitely not. Also, the stochastics do not reveal any dramatically over bought condition.

Stock Market Crash, NASDAQ

NASDAQ

The NASDAQ  pulling  back for the next few days and the Dow picking up strength over the next few days would be the exact opposite of what has occurred in these indexes over the past week or so. This would be more confirmation that the markets are in slow uptrends. As one is selling off, the other is picking up strength. This indicates that there is not any massive selling. The sectors are just rotating.

The portfolio should be predominantly long but anticipate moving from sectors that are topping out into sectors that are picking up strength.

Learning to Invest in the Stock Market Using the Bullish Engulfing Signal

Learning to invest in the stock market is a difficult process.  There are multitudes of sources that will give their opinions on how to invest.  For the person that is just learning to invest in the stock market, the massive amount of information can be overwhelming.  Becoming educated in investing should be narrowed down to one basic premise.  What investment programs should I utilize that fit my investment risk factors?  Learning to invest in the stock market not only includes finding an investment program that fits ones investment nature, but also finding a program that produces the  results an investor expects.

Utilizing candlestick signals makes learning to invest in a stock market much easier to understand.  The 12 major signals found in candlestick analysis not only reveal high probability reversal situations but understanding the psychology that formed those signals makes understanding why reversals occur much easier to comprehend.  One of the fastest and easiest processes for learning to invest in the stock market is learning the candlestick signals. Each major signal provides an immense amount of information.

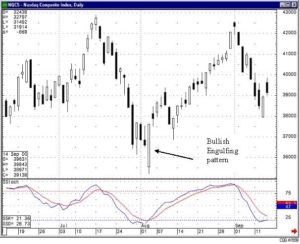
Bullish Engulfing signal is one of the major signals.  When the elements out of a Bullish Engulfing signal are broken down, an investor can clearly understand what was going on in investor sentiment to cause a reversal.  400 years of observations from Japanese Rice traders has recognized the Bullish Engulfing signal as a very high probability reversal signal.

Bullish Engulfing Pattern

BULLISH ENGULFING PATTERN
 
Description

The Engulfing pattern is a major reversal pattern comprised of two opposite colored bodies. The Bullish Engulfing Pattern  formed after a downtrend. It opens lower that the previous day’s close and closes higher than the previous day’s open. Thus, the white candle completely engulfs the previous day’s black candle.

Criteria

  1. The body of the second day completely engulfs the body of the first day. Shadows are not a consideration.
  2. Prices have been in a definable down trend, even if it has been short term.
  3. The body of the second candle is opposite color of the first candle, the first candle being the color of the previous trend. The exception to this rule is when the engulfed body is a doji or an extremely small body.

Signal Enhancements

  1. A large body engulfing a small body. The previous day shows the trend was running out of steam. The large body shows that the new direction has started with good force.
  2. When the engulfing pattern occurs after a fast move down, there will be less supply of stock to slow down the reversal  move. A fast  move makes a stock price over extended and increases the potential for profit taking.
  3. Large volume on the engulfing day increases the chances that a blowoff day has occurred.
  4. The engulfing body engulfs the body and the shadows of the previous day, the reversal has a greater probability of working.
  5. The greater the open gaps down from the previous close, the greater the probability of a strong reversal.

Pattern Psychology

After a downtrend has been in effect, the price opens lower than where it closed the previous day. Before the end of the day, the buyers have taken over and moved the price above where it opened the day before. The emotional psychology of the trend has now been altered.

Learning to Invest in the Stock Market, Bullish Engulfing Pattern