Risk Premium

Investors will demand a risk premium when taking on an investment with a measurable possibility of failure. A common explanation of risk premium is that it is the minimum amount of return on investment that a risky investment must produce when compared to a risk free investment. The investor accepts investment risk in return for a larger possible return on investment . For those totally averse to taking on risk there is the certainty equivalent which is guaranteed return one would demand in return for taking on a risk free investment. United States T-Bills are generally considered to be risk free investments. Thus the premium that investors require for a risky investment is typically the return offered by the risky investment minus the return on a Treasury bill.

Another way of viewing the risk premium is that it is the excess rate of return demanded by investors for taking on the risk of loss. In finding profitable investments one may look to stocks with more risk than one normally accepts. In accessing risk and required risk premium in long term investing or short term trading fundamental analysis is essential. Traders will follow market sentiment with Candlestick analysis and profitably trade market volatility . However, it is a collapse of fundamentals that commonly drives a company into bankruptcy or causes a payer to default on bond payments.

Choosing a number of such stocks in a stock portfolio spreads the investment risk . Taken to a much larger scale this is the theory behind junk bond funds. Because the risk premium is large for risky bonds a well chosen group of junk bonds can often outperform higher grade bonds as the higher rate of return more than makes up for defaults in the portfolio. The risk premium for stocks is determined by the stock market as investors and traders will not buy stocks unless the risk premium outweighs the perceived degree of risk.

Risk premium is largely a concern of long term investing as day trading concerns itself with short term stock price movement. For the day trader the fundamentals that determine risk premium are factored into the stock price as soon as they are known. Using Candlestick charting techniques traders can buy stock , sell stock , and sell short profitably by accurately reading market sentiment.

Although the trader is more concerned with technical analysis with Candlestick charting than with strict fundamental analysis he still must keep in touch with the fundamentals. Fundamentals not only drive stock price directly but they drive market sentiment as the stock market news tweaks the psychology of investing and trading in the unwary. Here is where stick adherence to Candlestick patterns benefits the investor and trader. When a Candlestick signal presents itself it tells the trader or investor that a high probability exists that a stock price will react in a specified manner. The trader or investor need only put his ego aside and follow his Candlesticks to improve his chances of profit. A this time risk premium is not the issue as the centuries of market experience distilled into Japanese Candlestick signals lights the way to profits.


Market Direction

The Dow closed right on the T-line today. The NASDAQ and the S&P 500 closed just slightly above the T-line but each formed a Doji. When analyzing a situation where the close is just above the T-line, it is important to take into consideration what type of candlestick formation was created. Because the NASDAQ and the S&P 500 showed indecisive trading just above the T-line, it will still be important to see how the markets open tomorrow. A higher open would indicate the trend is moving above the T-line. A lower open will indicate the T-line area was still acting as resistance, the down trending channel will still be affecting the trend.

Chat session tonight at 8 PM ET- guest speaker -Tina Logan -one of the leading investment trainers in the nation – join us tonight as Tina will illustrate specific techniques on how to be mentally prepared for successful trading.

2-Day Candlestick Analysis Training – Once the major candlestick signals are identified and understood, applying techniques to your trading will allow for a dramatically improved correct trade ratio. This today training session provides additional insights in how the major signals can be used successfully for identifying high profit patterns, effective entry and exit strategies, the correct stop loss procedures, accurate trend analysis, utilizing moving averages, trend lines, and Fibonacci numbers to further enhance correct trade probabilities.

Additional information about how to keep your emotions out of your investment decisions will be incorporated throughout this training process. Do not miss this opportunity to assemble the knowledge of candlestick analysis into a logical and easy to understand process. Discover how to utilize the information built into candlestick signals to understand price movements that takes most experienced investors decades to perfect. Click here for training information.

Good Investing,

The Candlestick Forum Team


Current Website Special

Scanning Tchniques Quick Download

Website Special reflects current newsletter. If you are reading an archived newsletter you will be directed to Current Website Special

2018 Stock Market Holidays

   UP Arrow GREEN      
Stock Market Holiday Calendars and  FREE E-BOOK
12 SIGNALS TO MASTER ANY MARKET
WHEN YOU SIGN UP FOR OUR NEWSLETTER

2018 Stock Market Holidays Date
New Year’s Day January 1, 2018
Martin Luther King, Jr. Day January 15, 2018
Washington’s Birthday/Presidents’ Day Febuary 19, 2018
Good Friday March 30, 2018
Memorial Day May 28, 2018
Independence Day July 4, 2018
Labor Day September 3, 2018
Thanksgiving Day** November 22, 2018
Christmas December 25, 2018
**The NYSE Trading Floor closes early (1PM ET) on
Friday the day after Thanksgiving

Remember, the professional money managers often vacation around scheduled exchange holidays.
They may also close positions several days before, causing lighter volume around the stock market holidays.


Candlestick Pattern

Candlestick Pattern Reversals

A candlestick pattern is a pattern that occurs on a candlestick chart similar to a bar chart and it indicates price movements over time. These charts were developed in the 18th century by a Japanese rice trader as a tool to provide information regarding future demands of rice. The pattern is a preferable method because the visual representation of what is happening in the markets is better visually depicted on candlestick charts than on other types of charts. Japanese candlestick charts are able to display five data points as opposed to other more basic stock charts such as line and bar charts.

In today’s article we will discuss the five bullish candlestick reversal patterns as they relate to what is occurring in the markets. We will discuss the doji candlestick, the engulfing reversal pattern, the hammer reversal candlestick pattern, the piercing pattern, and the harami.

Doji

This is the first pattern that most traders learn about when studying Japanese candlestick charting. This signal represents indecision in the market and as a result, traders question the current trend. It will often cause reversals since the stock opens up, goes nowhere during the day and then closes right back up at or near the opening price.

Engulfing

When this bullish signal occurs, it means that the sellers are overwhelmed and the buyers are ready to jump back in and take control. The demand is greater than the supply, in other words. The name comes from the second day of trading stock when the second candle engulfs the body of the first candle, while closing near the top of the range.

Hammer Pattern

This candlestick pattern typically occurs after a group of stop loss orders are hit and it is then that traders show up to take hold of shares at a lower price. This signal indicates that the sellers tool control of the stock and pushed it lower than its opening price. Then at the end of the trading day, the buyers came back and closed the stock at the top of the range.

Piercing Pattern

This bottom reversal pattern has the potential to be very powerful when candlestick trading. With this pattern the sellers are in control on the first trading day. There is potential for traders to regretfully short their stock on the first day and miss the boat when prices may continue to decline even more. This is because on the second day the price gaps down but the bulls step in and dramatically turn prices around. This move almost completely negated the price decline that occurred the previous day.

Harami

This candlestick pattern should not be confused with the engulfing pattern, but it often is. On the first day the sellers are in control of their stock and then on the second day, there is only a narrow range candle that closes up for the day. Momentum often comes to a halt when this signal occurs.

When analyzing chart pattern reversals it is important to know that bearish patterns are the opposite of bullish patterns. Bearish patterns come after the rally and they signify possible reversals just like the bullish patterns do.
Continue your Japanese candlestick education and learn about bearish patterns and other important candlestick chart patterns as well!


Market Direction

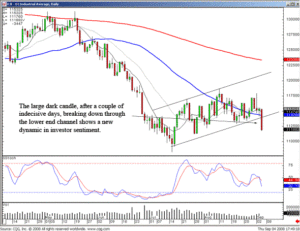
The sideways movement of the market was going to continue until there was a definite break of the trend channel. After two months of indecisive trading, today showed a breach of the lower part of the trend channel.

Candlestick Pattern, Dow

DOW

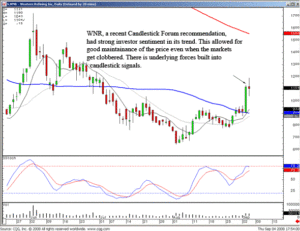
Fortunately candlestick signals reveal where recent strength is coming into sectors. This has two benefits. First, obviously is directing funds to the high potential profit areas. Second, when the markets get a big tumble as seen in today’s trading, the stocks that have exhibited strong buying will not be as severely affected to the downside. Usually strong buying interest will not reverse immediately if the market in general takes a big sudden downward move.

Candlestick Pattern, WNR

WNR

Candlestick signals provide an immense amount of information. This information can greatly improve an investor’s returns whether in a market trending in the expected direction. It also protects investment funds when unforeseen reactions occur.

Seasonal Trading – September 11, Best Choice software will be demonstrating how their software program identifies the areas that will act well during specific times of the year. Adding Candlestick analysis makes for a powerful investment combination.

Click here for instructions.

If you already have HotComm installed, click here to connect.

Good investing,

The Candlestick Forum Team

Website special reflects current newsletter. If you are reading an archived newsletter you will be directed to Current Website Special.

Best Penny Stocks

When trying to find the best penny stocks to invest in it is important first to understand just what exactly penny stocks are. There are multiple definitions available but the easiest one that is generally accepted is the definition that a penny stock is any stock priced under $5.00 a share. (per the SEC definition, penny stock status is determined by share price, not market capitalization or listing service.)  When you buy penny stocks, the company for that stock is valued at about $4 million dollars or less and it is typically a relatively new company with not a lot of history. Many investors feel that investing in penny stocks is a huge investment risk, but if you pick the best penny stocks, you can make a good return on investment. Picking penny stocks that are worth investing in is very hard to do and is a combination of difficult analysis and speculation. It is tricky because a really good company may not make a good investment when investing in penny stocks.

There is a lot of money to be made when penny stock investing, but it necessary to have expert knowledge of what to buy, how to buy, and to do the required research. The most important thing that you can do in order to pick the best penny stocks is to work on getting leads from professionals, and then look into and research those companies yourself. The point and the advantage to investing in penny stocks is the ability to turn a small investment into a fortune. The list of penny stocks available to investors typically contains a list of many young companies that start out as penny stocks and then eventually climb out of that status. Many companies will wait to go public until their stock is worth more than the penny stock range with the determination to be traded on the public stock exchanges.

The best penny stocks have a consistently high volume of shares that are traded therefore providing an acceptable rate of return. It is very important however to be cautious because it is possible to skew the results of average volume trading. There are those bad investors who look for quick opportunities to make money so you must be sure that you understand the game. In order to be successful when investing in stock of this nature is to ensure that someone isn’t just trying to push you to buy stock so that they can quickly sell and run away with your money. Another downside to investing in penny stocks is the volatility of shares and the lack of corporate transparency. It is very important when looking for penny stocks that you do not buy them from consumers who use high-pressure sales tactics or from anyone that guarantees you a return. There are no guarantees in this online stock trading game!

Remember, selecting the best penny stocks is not a skill that you can develop overnight. It takes years of experience and research before you can make a significant income. It is wise to not only study how to buy penny stocks but also to develop a network of peers. You will learn faster through developing relationships with other penny stock investors who have been through the trenches. You can do this by joining online forums or investments clubs. Your peers can offer you investment advice based on their experience and may save your from making the same mistakes that they did.

Understanding Fibonacci Indicators in Technical Analysis

Since stocks have a greater tendency to retrace, rather than move in a straight direction, traders use the Fibonacci Indicators as reference points to predict a retracement versus a reversal. Extremely accurate when analyzing chart pattern reversals. Fibonacci indicators also provide an excellent visual map. Combined with Candlestick Signals, the savvy trader can find optimum entry and exit points.

An effective Candlestick trading tactic is to  look for small double bottoms or double tops within these lines to identify trading opportunities. Congestion can form around the 38% and 62% levels, so watching for Candlestick Breakout signals at these levels can forewarn of significant price moves. Just like moving averages, the Fibonacci indicators work like price magnets to old highs or lows. For an even greater degree of accuracy they should be combined with the major japanese candlestick patterns.

Most common numbers used in technical analysis for drawing Fibonacci lines are 62% (61.8% rounded up), 38% and 50%. For existing trends, the 38% level should be the minimum retracement but can go down as low as the 62% level. As price retraces, support and resistance occurs at a high rate near the Fibonacci levels. In an existing rising trend, the retracement lines descend from 100% to 0%. In an existing downtrend, the retracement lines ascend from 0% to 100%.

Technical Analysts use these Fibonacci Indicators  (Fib-lines) to predict Price Targets and Support/Resistance Targets. To accurately draw the lines to identify these patterns you begin drawing from the lowest point (which equals your 0 percent line) to the highest point (which equals your 100% line). The 38%, 50%, and 62% lines will provide your reference point for targets.

While nothing can predict the future with 100% accuracy, adding these to your technical analysis tools  greatly enhances your ability to be in profitable trades. Adding the candlestick signals provide a huge advantage for being able to immediately recognize what is going on in investor sentiment at these levels. Don’t force the picture; should you come across a chart where the Fib-lines conflict with your other technical indicators (such as moving averages), move on to another chart. There will be plenty of charts providing greater confirmation when all your technical indicators are in agreement. (More about our newly released 30-minute training tutorial Fibonacci Trading Techniques)

Finding Stock Entry Signals with Japanese Candlesticks

Learning the psychology behind accurate stock entry signals will truly alter your investment aptitude. You will start looking for “buy” signals in oversold stocks. You will start anticipating when to take profits in overbought stock positions. Remember, you are not being shown “secrets” of the investment world. You will be learning a trading program concept that will educate you on how the common investor thinks, then turn that thinking into huge profits. And you will learn how to do it without having to experience all the learning bumps that I did.

Coming around full circle, thinking what I would be thinking if I was reading all of this, is the same question that I would pose to all the other magnificently sounding investment programs that are on the market, “If this trading program is so great, why are you exposing it to everybody else?”

The One Major Drawback to Japanese Candlesticks.

Through the years it became apparent to me that the Candlestick trading signals were truly profitable trading indicators. So accurate that this system should be catching on like wildfire. However, the more I became convinced that the Candlestick methodology outperformed all other technical methods, the more I was surprised that very few people knew about its benefits. Very few. It was hard to find anybody who could intelligently converse about the signals. I can count on one hand the number of people that I could talk Candlestick trading with over the past ten years. And most of them had published books on the subject. The problem was that there was nobody to analyze my analysis, to confirm or reject what I saw in a signal formation. Essentially nobody knew how the Candlesticks worked and how positively effective they were.

It became apparent that this lack of knowledge would be detrimental in trying to establish a hedge fund using the Japanese Candlestick trading method. Convincing investors to invest in a fund that produces extraordinary returns, using Japanese Candlesticks, not a sophisticated sounding trading method, would be an uphill battle if trying to market to an uninformed public.

The truth of the matter is that teaching thousands of investors to utilize Candlestick investing will never affect any investments that the Candlestick Forum would be participating in. Each investor has their own specific areas of investment interest. Large cap stocks, bonds, grains, currencies, meats, options, and dozens of other investment vehicles will be the object of their investments. Even thousands of new Candlestick investors out in the investment arena would be a drop in the bucket compared to the many millions of investors in the world.

Take advantage of this candlestick investing knowledge. It will not take weeks or months to verify whether the signals work. They will prove themselves instantly. If you always keep in mind that the signals are the result of a change in investor sentiment, your road to extracting great amounts of profits from the markets will occur very quickly.

Effective Stock Market Trading System – Candlesticks!

Most investors do not have a stock market trading system. Unfortunately, that is usually a natural evolution of learning how to invest. We become educated, we develop a career, we earn money and then we have to figure out how to invest our money. There is no educational institution that will show us how to invest or even set up a stock market trading system. We usually learn by the seat of our pants. But the age of computer is changing all that. The Internet has provided the information for investors to make their own investment decisions. This is much different than how investment information was disseminated a mere decade ago. With the development of computer software, the dynamics of the investment arena has changed dramatically. An investor can develop their own stock market trading system. They have all the information that is available to every investment professional in the world right at their fingertips. Candlestick charts provide this information at a quick glance.

Candlestick analysis is just now coming into its own because of computers. Here is a stock market trading system, although a few centuries old, that is benefiting from today’s computer technology. It can be assumed that the correct trade ratio for candlesticks has to be relatively good or we would not be witnessing them today. However, they were developed without the benefit of a multitude of investment parameters that can be found on computer systems today. In the following months you will be exposed to some of the techniques from modern-day computer research that when applied to candlestick signals enhances the probabilities of being in the correct trade all that much more. This is the best of both worlds. Taking a stock market trading system that has worked for centuries and being able to tweak it constantly with improvements that are showing up every day through computer research. The Doji, forming at the 50 day moving average, is one of those patterns that has been found to greatly improve returns.


Market Direction

As mentioned in last week’s newsletter, the Long-legged Doji, forming right on the 50 day moving average, would and did become the pivotal point for the next major move in the market. The Doji forming a 50 day moving average as an important alert for a substantial move in a current trend. ( Further explanation can be seen later in this newsletter ). Friday was a bullish day. The NASDAQ had a good strong bullish Candlestick signal, a bullish day that came more than halfway up into the last large dark candle of Wednesday, after a gap down inverted hammer. The Dow had the same strong reaction. The Dow did have a good bullish day, a Bullish Harami. The question then becomes whether this is a full-fledged reversal or merely a bounce back up. However, even a bounce should be substantial enough to make some profits on the long side. The 50 day moving average now becomes a resistance target.

Common sense dictates that you try to invest in the direction of the trend on the market. Why try to swim against the current? However, keep in mind that the candlestick signals are the cumulative knowledge of everybody that was buying and selling that day in whatever trading entity or index. That point becomes quite clear in our recommendation of SUPG this week. During a time when the markets were selling off dramatically, the chart of SUPR revealed an extremely strong Candlestick buy signal. The Doji, followed by a gap-up and a strong bullish day, illustrates that the buying was coming into this stock in spite of the fact of the markets were being sold off heavily. The advantage of the candlestick signals is that it tells you exactly what the investors are doing. It can be assumed that something had to motivate the buyers to buy aggressively in SUPR when they knew the rest the market was being sold.

Online Stock Trading

The stock market has become the scene for those individuals who have learned to build a strong portfolio with online stock trading.  Most investors keep an eye out for stock that is rising however, some experienced traders are spending their time finding stock that is on the brink of dropping. This type of stock trading is known as selling short.
There are a couple of reasons that an investor would want to sell a stock short when online stock trading. One reason is that a stock will drop in price about three times faster than it took to increase in price by the same amount, meaning faster profits. Another reason is that many stocks run in cycles due to various economic and seasonal conditions. This means that traders can take advantage of all the moves a stock has at hand when online stock trading.

Selling Short When Online Stock Trading

Selling a stock short is the exact opposite as buying and holding stock when investing in stock. Instead of the more traditional method of buying stocks and profiting from the share price gaining in value, it is actually profiting from a stock falling in price. When one sells short they expect the share price to lose value and profit from the decline in price when online stock trading. Please note that when you sell a stock short, you are borrowing the shares from your broker. If after reading this, you decide to begin trading stocks short, you must first open a margin account.

Tips for Online Stock Trading

When new to online stock trading, start low with lots of shares such as 100, and avoid jumping in with orders for 1000+. Mentally, at first, a trade with 100 shares going against you is easier to take than one with 1000 when trading stocks.

When online stock trading, you must know where your exit points in the trade will be, including your stop loss value. It is important to take losses and not let a losing trade run away while you hope it will turn in your favor later on. It’s very possible that it may not.

Stock market tips also include looking at the previous day’s trading range by subtracting the high of the day from the low of the day. Stock chart patterns with large ranges will give more opportunities for larger moves for you to capture compared to stocks which only fluctuate by a few cents each day.

When online stock trading, if the lead stochastic crosses below the 80 band consider this a sell signal, and if it crosses above 20, then it would be a possible buy signal.

For futures analysis, if the futures are in an uptrend, but your stock is moving down this could signal a possible explosive move down when the futures start to go back down again. The same applies in reverse for moves up when online stock trading.

If trading NASDAQ stocks, be aware of what the futures are doing. Stocks usually move with the futures. When online stock trading, it is typically a bad idea to short a stock if the futures are in a strong uptrend and vice versa for going long.

Forex System

One of the most important steps necessary to begin forex trading is determining what type of forex system you will use. There are multiple trading systems available so you must find one that works for you. When looking you must conduct extensive research and take your time to find one that best suits you. This step in the process is imperative to your success in trading forex. This article provides a few pointers for choosing a system and it discusses the new innovative technology available for forex traders, known as automatic forex trading.

When deciding which system you will use to trade forex, you must be sure that you don’t fall in to the gadget trap. Bells and whistles may draw you in, but fancy systems are really unnecessary. Most forex traders find that the simpler the system the better. The forex system you choose must identify possible profits, should cut your losses and should assist you or enable you to conduct fx trading through using the breakout method.

Automatic forex system trading is said to be the “revolutionary trading mechanism that is going to change the conventional approach towards currency trading.”  This system does not require the manual management by a person to handle the accounts when trading currency, but instead is managed by a machine that manages the buying and selling actions of the trader. It is projected that these systems can assist with increasing the return on investment, and will enable the forex trader to trade with multiple systems. It is said it will also allow the trader to trade for a short or long-term through the use of different trade indicators. Basically sine you can trade in the forex markets 24-hours a day, it is said that this system can potentially make you money while you sleep.

There are two types of automation systems used for forex currency trading. One is web-based and the other is on your desktop. The main difference is the level of security you get with both forex systems. With the desktop version your information is exposed to potential viruses or hackers. Web-based versions are available via your web provider through a secured server. The other difference is that if you use the desktop version you lose your hard drive, you are out of luck. That is where all of the information is stored, so unless you backed up, you are in trouble. The web-based versions of the forex trading systems are backed up by the forex system provider so you don’t have to worry. The desktop version is cheaper so many forex traders still opt to use it.

Manual systems have become outdated in the financial markets due to the atomization of trading systems. If you opt to go automatic, be sure that you select a system that has been programmed by the experts. They are pretty costly so be sure that you find one that is reliable and that works for you if you go down that road. Look online to find a forex system that works for you and also be sure that you talk with fellow traders to get their opinions on systems that they may use.

Trading Momentum Stocks

Trading momentum stocks works for two basic reasons. It has been demonstrated that stocks that have been performing well tend to continue to outperform the rest of the stock market. Theorists argue as to whether this phenomenon is due to irrational investor behavior or a fundamental reason that these stocks are better managed companies that continually prosper while others fail. For the trader or investor trading momentum stocks the theory does not matter. What matters is having an efficient system of stock market analysis for recognizing and trading stocks that seem to have momentum.

When trading cyclical stocks a day trader will look for support and resistance zones. Day traders will look at Candlestick pattern formations to help them determine when to buy stock and sell stockLong term investing dictates that the investor must perform fundamental analysis of a stock. So, why can a trader simply choose a stock that is going up and jump on for the ride? Because very often it works out quite well! Whether the fact that a stock keeps going up in price is due to irrational psychology of investing or a warped psychology of trading makes no difference in technical analysis of stocks. It is the time honored principle of Candlestick basics to let the market tell you what the market will do.

In value investing the investor may often discover an overlooked and undervalued stock with promising prospects and a ridiculously low price to earnings ratio. A small cadre of investors who follow just a few market sectors may have found a stock and may be progressively bidding it up. The successful individual in trading momentum stocks does not really care! The trader or investor trading momentum stocks just engages in trend analysis and follows the trend.

Trading momentum stocks involves generating trading software trade signals by following current market calculations, moving averages, and channel breakouts to understand market direction. The individual will trade stocks that fit a set of criteria and sell or buy stocks based upon a predetermined trading strategy. Because the trader does not care what the underlying reason is for the stock price movement, he or she needs to have a predetermined set of rules for exiting a trade if the market reverses.

Risk management in trading momentum stocks includes the current market price, how much money is in the trading account, and market volatility at the exact time of trading. As these factors change, the investment risk management equation changes. This calculation should be part of the trading software. When prices change, the size of the trade typically will increase or decrease. The degree of market volatility will also help determine the size of stock trades. Day trading in momentum stocks, whether the movement is up or down, typically involves the longer term movement of a stock or the “turnaround” of a stock in the market. This type of trading looks for stock market trends, not stock market reversals. When there is a change in price movement the trader needs to have a pre-established strategy that leads to a quick exit from the stock position. However, once the trend establishes in the other direction the trader can trade the stock again. Trading momentum stocks works in both directions.


Market Direction

A major benefit of candlestick signals is the immediate identification of what is occurring in a price movement. Just a simple factor such as a white ( bullish) candle forming, based upon where the price opens, allows for immediate analysis. What do you do with a position that gaps down during its uptrend? There are very simple rules for closing out positions that are not performing as the chart analysis had predetermined. A gap down below the previous day’s open, in the overbought condition, has different ramifications than if that same situation occurred when the stochastics were showing the stochastics not in the overbought condition.

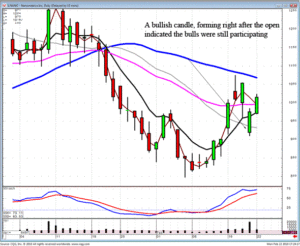
As illustrated in the NANO chart, which had been a recent recommendation, the initial reaction to the earnings was very negative. It gapped down, well below the open of the previous days candle. The stochastics had just barely started climbing into the overbought condition. The normal rule is to close the position immediately, especially if the price is well into the overbought condition. Logic says that an uptrending stock price should not experience a gap down. That is not what should occur if the Bulls remain in control.

Trading Momentum Stocks, NANO

NANO

As witnessed in the NANO chart, the price not only gapped down, it gapped down below the T. line. This would have normally caused an immediate close of the position. However, the visual effects of candlestick analysis did immediately identify the fact that the Bulls started stepping in almost immediately. This would’ve been revealed with the formation of a white candle as the trading occurred above the open price. This provides some very important information. Although there was an extensive gap down in price, the bulls were still participating. Obviously, this would have been a much different analysis had the price gapped down and then was followed by continued buying.
The results would have been to continue to hold that position until it was evident the Bears were taking back control. As can be seen, the remaining day experienced continued buying, followed by another day of buying. The T. line rule was not violated. The price did not close below the T. line.

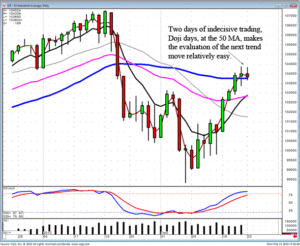
Candlestick analysis provides the information that prepares an investor for high probability price trend results. That can involve whether to sell or remain long or getting prepared for a change of a price trend. The Dow formed a Doji during Friday’s trading. It formed another Spinning Top today. Both the Dow and the NASDAQ are in the overbought condition. They are both also trading right at the 50 day moving average. This makes the evaluation of the overall market trend relatively easy.

Trading Momentum Stocks, DOW

DOW

One of the Doji rules, the trend will move in the direction of how they open the price following a Doji. A lower open tomorrow becomes very meaningful. The Dow will be experiencing a lower open after a Doji, in the overbought condition, and trading back below the 50 day moving average. This combination of analytical tools would make it quite clear that it was time to take profits and maybe adding some short funds to the portfolio.
There is an immense amount of information built into candlestick signals. Not taking the time to learn that information greatly diminishes the opportunity to consistently take profits out of the market. It allows an investor to be prepared for the next price change or the  continuation of a current price trend. In either case, specific price movements will cause specific results. This may sound like an elementary statement, but the if/then aspects of candlestick analysis permits an investor to move much more quickly for establishing positions or taking profits. This information is vital whether investing in stocks, options, or commodities.

Chat session tonight at 8 PM ET.

Thursday night February 25, Tina Logan will be presenting more information about being a professional thinking trader.

Good Investing,

The Candlestick Forum Team


This Week’s Special

Profitable Entry Exit Strategies

Click here for details