Archives for August 2019

Paper Trading Options

It is always nice when someone gives you something for nothing, an extra doughnut at the bakery or that tool you need. Other people want to give you something for free as well; an education paper trading options. Paper trading options is a process in which you can simulate the real decision-making process of options trading without committing real money. 

You approach paper trading options the same as you would a real trade in the stock market, taking into account everything you would consider if you were making a real investment, and implementing your positions on the computer. By analyzing how your theoretical investments perform you can evaluate whether your stock trading plan and your technical analysis tools are working without the pressures of possible financial loss.


Why Paper Trading Options Is A Good Idea

Paper trading options gives you the opportunity to practice and learn without the financial danger of real losses. You can fine-tune your stock trading system, test it and improve your investment philosophy in theory before going live. You can learn stock market terms, techniques and practices without pressure. 

It is also easier for you to test your trading rules in a simulated trading environment than in the real market. When you have actual money at stake, emotional reactions such as greed and fear can sometimes affect sound judgment. If you can resist those feelings and follow your stock investing system , your paper trading options approach, and later your live options trading, will be much more successful. 


A Little Explanation of Options 


Options trading is different from typical investing in the stock market or bonds since you don’t actually own anything. In options trading, A stock option is not a physical thing like holding shares in a company. Instead it is a contract between two parties. When you own stock you actually own part of a company. An option is an agreement, or contract, where one party agrees to deliver something to another party within a specific time period and for a specific price.


This distinction is important because with options you are not borrowing anything. For example, in the case of stock, you must first borrow the stock if you are selling short; with options there is nothing to borrow so you can short options without the worry of borrowing first. Options are popular because they can help you leverage your positions, meaning that you don’t move on a few shares but hundreds or thousands. Instead of buying a stock outright, you can enter into an options contract which can be much cheaper but have the same, or even better, returns.

The Profit Potential of Options Trading

With options trading, you have the best of both worlds; limiting your risk and at the same time leaving you open to make unlimited profit if the market rallies. It is important to say that not all stock option trading strategies have the same payoff benefit. Only if you are buying options can you limit your risk. For option sellers, this is the reverse since they have unlimited risk with limited profit potential. While this sounds dangerous, once you understand the options available to you and how to use them, you can limit even the unlimited risk when you sell strangle.

Getting Started Paper Trading Options

There are a large number of companies on the Internet that offer free options paper trading; a simple search will give you more choices that you can imagine. These companies offer this service in hopes that after you get comfortable paper trading options, you will open a commodity account with them. In the meantime, once you have registered simply follow the directions of the stock market investing software and you are ready to begin. 

What You Might Notice

If you try to implement positions before you understand options trading, you will probably be surprised; options trading has a different set of terminology, different strategies and even the trading software will probably be confusing. So before you try to begin giving yourself an option trading education; learn the terms, learn the techniques, and learn the stock trading software where you are paper trading options. 

Does Paper Trading Options Really Matter? 


In and of itself, paper trading options is not crucial; it is merely a simulation of the things required to trade options in the real world. What is important while paper trading options is your mental approach; if you treat this like a game or don’t understand the importance of learning options trading, you should seriously reconsider attempting to trade options. This is a skill and the consequence is losing your money so don’t take paper trading options lightly. 


Conclusion 


Getting something for free doesn’t happen everyday, especially in the business world. It is time that you put down that free doughnut and take advantage of this unique opportunity and start paper trading options today.
Stock Price Analysis

Stock price analysis lies at the root of profitable stock trading. Stock traders profit from buying stock, selling stocktrading stock options, and trading futures on stocks. Traders profit from the price difference between entering a stock position and exiting. Thus stock price analysis is essential. Long term investing relies upon an analysis of the margin of safety of a stock and intrinsic stock value. However, buying a promising stock that has already run up in stock price can greatly diminish profits. Thus stock price analysis can be as important for the long term investor as it is for the day trader. Both long term investors and traders can profit from the use of Candlestick analysis. This easy to read technical analysis tool allows traders to execute trades with a high statistical probability of success without falling prey to the twin stock market trading demons of fear and greed.

Stock price analysis can be carried out with the long view in mind and with an eye towards minute by minute day trading profits. A conservative investor may wish to have a couple of dividend stocks in his stock portfolio. Using stock price analysis he will often buy these stocks when interest rates are high because the stock prices of dividend stocks will commonly be low at these times. When interest rates fall the investor will have the choice of continuing to receive dividends or selling the dividend stock at the now-higher stock price. On the other hand the day trader will commonly use Candlestick stock charts in order to anticipate short and medium term stock price fluctuations. Although the long term investor will commonly prefer a very stable and predictable stock the trader will commonly look for stock volatility and market volatility which picking stocks in search of short term trading profits.

It is common for successful investors to use technical analysis tools such as Candlestick patterns in choose if and when to purchase a stock. The long term investor will look for stocks with strong forward looking earnings potential as well as the margin of safety that cash in the bank and unencumbered physical assets represent. However, such stocks are often highly priced as investors are willing to pay for the promise and security that the stock offers. Thus an astute investor will often pass on such otherwise promising stock after seeing its high price to earnings ratio or high price to sales ratio. Here is where tools such as Candlestick pattern formations come to the aid of the long term investor. Even very stable and successful companies see their stock prices fluctuate during stock market crashes, rumors of mergers and acquisitions, or news of a new product coming out from a competitor. By using Candlestick signals for stock price analysis the long term investor will commonly be able to gain market insight during times of high price volatility and successfully purchase the stock in question on a short term correction. Whether one is interested in long term investing or trading for short term profits, stock price analysis with Japanese Candlesticks gives one a high statistical probability of success without the confusion and mistakes that the psychology of trading can bring about.


Market Direction

Has the downtrend reversed? Has the candlestick signals revealed reversal signals? Although the markets are still in a slow down trend, there have been candlestick reversal signals being formed at these levels. That is providing valuable information. It is visually revealing that buyers are starting to step in at these levels. There are very simple strategies that allow investors to be positioned correctly if a transition in the market trend is starting to take place. 

Private training sessions – August 2011 – It is often asked what are the benefits of attending a private training session. There is a definite benefit to learning candlestick signals and patterns and the related factors surrounding candlesticks that produce consistent profits. These private training sessions, consisting of three or four traders being instructed by Stephen W Bigalow allow for very concise demonstrations and answers to one’s personal questions. Have you ever gone through a training session where your questions were quite answered to where you fully understood? And then the remaining portion of the training session was a little bit hazy because you weren’t fully understanding a specific aspect? A private training session consists of two solid days of viewing and understanding how candlestick analysis works effectively. You will not be provided with information that you have to figure out how to use correctly. You will be instructed in how to use candlestick signals correctly. You do not believe the training with any un-answered questions in your mind.

When you see how candlestick analysis is derived from common sense investment practices, your concept on how to invest correctly is completely altered. You will understand how to buy at the bottoms when everybody else is selling and selling at the tops when everybody else is buying. You will learn how to scan for the high probability/high profit trades. You will learn how to automatically set your stop loss procedures without having any emotional attachment. The learning process is not a “drum into your head” memorization process. Stephen Bigalow shows you how to interpret high profit trading patterns as a natural visual perspective. What makes it even better is the learning environment. The teaching process is done on a porch reviewing charts while also enjoying the clear waters of Keuka Lake, a beautiful Finger Lake of New York State. Breaks do not consist of getting a drink at the water fountain in the hallway of a stark hotel. Breaks at these training sessions consist of taking a dip in the cool and refreshing waters of the lake. The learning process does not end away from the computer screens. Investors can continue to ask questions and get answers from Mr. Bigalow at some of the best wineries in the nation or at dinner in a historic hotel restaurant overlooking the lake.

When you finish a candlestick training session, you will have gained a completely different perspective on what makes consistent profits in the markets. You become a controller of your investments versus the markets controlling you. Do not miss this opportunity to gain valuable insights into the most proven investment program in the world. The nuances of 400 years of candlestick observations, when conveyed to you in very pleasant surroundings, allows you to go home and make consistent returns. These training sessions are an excellent getaway for bringing your spouse and having them enjoy the attractions of the New York’s Finger Lakes region. Seats are obviously very limited. We will have this item posted in our site on Friday.

Chat session tonight at 8 PM ETEveryone Is Welcome.

Good Investing,

The Candlestick Forum Team

The Harami – A High Profit Candlestick Signal, Stocks & Commodities Magazine

The Harami is one of the major candlestick signals in Japanese Candlestick analysis. There are approximately 50 to 60 signals in the Candlestick signal universe. The biggest deterrent for many investors trying to learn the candlestick signals is a large number of signals. Most investors complain that there are too many to learn. Mastering Candlestick analysis can be done very easily by learning the 10 major signals. Knowing the signals, and understanding how those signals are formed, provide investors with a tremendous insight into what goes on an investor sentiment at reversal areas in a trend. Being able to identify the major signals and understand the investor sentiment that created those signals allows an investor to project market reversals with a high degree of accuracy. This is based upon hundreds of years of actual observations by Japanese rice traders. Simple logic tells us that if these signals did not work, they would not be here for us to view after centuries of use.

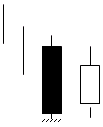
All the candlestick signals do not need to be memorized. Most signals do not occur often enough to use mental energy for identifying them. The 10 major signals will produce more investment opportunities than most investors will require. The Harami is considered one of the major signals. The Bullish Harami is a two formation pattern. The first formation is usually a large black candle appearing at the end of a downtrend. The end of a downtrend is represented by stochastics being in the oversold area. The Bullish Harami is formed by the second candle opening above the previous day’s close and closing below the previous day’s open. In Japanese, Harami means pregnant woman. As you see in the illustration, the black candle is the woman’s body, the white candle is her belly sticking out.

Harami Candlestick Pattern
Harami

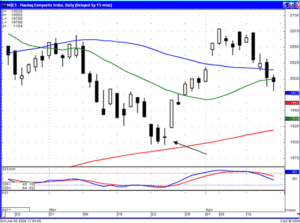
A Harami at an important support level, as seen in the Nasdaq chart, is more effective when a Doji is part of the two day Harami signal. Once the trading came near the 200-day moving average, the Doji/Harami being confirmed with a gap-up the next day becomes a very high probability projection that the trend has reversed.

Harami Pattern NQCS

NASDAQ Harami

Excerpt from the book “Profitable Candlestick Trading” 

Description

The Harami is an often seen formation. The pattern is composed of a two candle formation in a down-trending market. The body of the first candle is the same color as the current trend. The first body of the pattern is a long body, the second body is smaller. The open and the close occur inside the open and the close of the previous day. It’s presence indicates that the trend is over.

The Japanese definition for Harami is pregnant woman or body within. The first candle is black, a continuation of the existing trend. The second candle, the little belly sticking out, is usually white, but that is not always the case (see Homing Pigeon). The location and size of the second candle will influence the magnitude of the reversal.

Criteria

  1. The body of the first candle is black, the body of the second candle is white.
  2. The downtrend has been evident for a good period. A long black candle occurs at the end of the trend.
  3. The second day opens higher than the close of the previous day and closes lower than the open of the prior day.
  4. Unlike the Western “Inside Day”, just the body needs to remain in the previous day’s body, where as the “Inside Day” requires both the body and the shadows to remain inside the previous day’s body.
  5. For a reversal signal, further confirmation is required to indicate that the trend is now moving up.

Signal Enhancements

  1. The longer the black candle and the white candle, the more forceful the reversal.
  2. The higher the white candle closes up on the black candle, the more convincing that a reversal has occurred despite the size of the white candle

Pattern Psychology

After a strong down-trend has been in effect and after a selling day, the bulls open the price a higher than the previous close. The short’s get concerned and start covering. The price finishes higher for the day. This is enough support to have the short sellers take notice that the trend has been violated. A strong day after that would convince everybody that the trend was reversing. Usually the volume is above the recent norm due to the unwinding of short positions.

End of excerpt

The significance of a Harami is that it tells us that the selling has stopped. As far as a trend reversal, the Harami has excellent capabilities of indicating how strong the new trend to the up side will be. For example, if a Harami opens and closes at the very low end of the previous day’s black candle, the trajectory of the new uptrend may be very flat or slow. If the Harami closes midway into the previous black candle, the up words trend will be moderately strong. If the Harami closes near the top of the previous day’s black candle, the new uptrend may be very strong. In this way, a Harami can act as a barometer for the buying sentiment in the new uptrend.

A Harami can be additionally determined if it appears at a significant technical level such as a trend line or a moving average line. For example, witnessing a Harami that is formation in an oversold condition becomes much more significant if it is also forming on a 50-day moving average or a 200-day moving average. This becomes instant verification that what most western technical analysis is using for a possible support level is becoming instantly verified by a Candlestick signal. The Candlestick signal creates an immediate buy point whereas other technical analysis may need additional time to confirm. The candlestick analyst can profit immediately.

The Bearish Harami is exactly opposite the Bullish Harami. After an uptrend and the stochastics are in the overbought area, there will be one last white candle. The following day opens below the previous day’s close and closes above the previous day’s open. This will form a black candle inside the previous day’s white candle. This essentially tells us that the buying has stopped. Confirmation is seeing the next day open weaker.

Harami Pattern Crude Oil

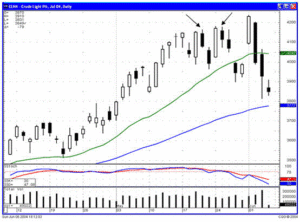
Notice the Bearish Harami’s in the Crude Oil chart. In late May, the experts were projecting that oil prices could go to $60.00 per barrel. This analysis was prompted by Crude Oil going above $40.00 a barrel for the first time in decades. However, every time the price would push above the $40.00 per barrel price, the Harami’s revealed that the sellers were stepping in. What is the smart money doing? You do not need extensive research team to delve into what is happening in each industry, stock or commodity. The signals tell what is the actual investor sentiment.
Just like the Bullish Harami, the Bearish Harami will indicate the magnitude of the new downtrend by where it closes in the previous day’s candle. A very small candle at the top end of the previous day’s white candle would indicate every slow downtrend whereas they close at the lower end of the previous day’s white candle would indicate that the selling pressure is going to be much stronger.

Understanding what the Harami signal is representing, the better the opportunity is to profit from the signal. The results, from witnessing a Harami, are fairly predictable. The Japanese rice traders established the statistical analysis to warrant the signals to still be in effect after centuries of use. Use that information to your advantage.

Training Tutorial available on The Harami

Scanning For Trades That Produce Higher Profits

Traders can spend too much time scanning for trades. It almost sounds paradoxical; an investor needs good trades to be profitable, but spending hours in vain searching for the “needle in the haystack” typically produces nothing but another bad trade. It is actually quite easy to pick stocks. Who hasn’t looked back and said something like, “I knew to buy Microsoft when it was $2.00 a share.”? The pick is easy; for most, taking a position is the hardest part. While it is easy to sit back and hope for stock market tips, a proactive investor will combine a stock trading plan with a proven stock trading software to form a channel for locating and buying good stocks.

A stock trading system is fundamental to every trade and something that the investor establishes prior to moving in the stock market. A stock trading system, such as candlestick analysis stock market investing is the method of interpreting movements in the stock market. Scanning for trades using stock scanning software is the final critical piece needed to help the investor to make his or her own trading tips.

There are many software programs available for scanning for trades. It is important to find one that offers the desired features and results without excessive processing time or confusing programming requirements. Simple online searches or the best investment advice from satisfied friends can be the most successful ways to locate a software package. The important thing to remember with any stock market investing software is that the purpose isn’t to locate the perfect trade. Scanning for trades with software only provides the data needed to perform stock technical analysis. This will allow the investor to use his or her stock investing system to provide the tips needed to make a trade. The best trading tip available is for the investor to use his or her own eyes. A good formula is to use while scanning for trades is to identify a crude group of prospects, then for the trader to review the list for prospects. After this is complete, an analysis of the chart formations becomes much easier to complete since the data is inclusive.
An excellent trading tip is to make the stock scanning software become part of the process for identifying potential trades, not the final authority. When using candlestick trading tactics, a trader can then evaluate the candlestick chart formations and determine a course of action. Chart formations indicate the direction a stock is moving and any unusual directions it might encounter in the process.

The “needle in the haystack” is the thing that every investor wants to find. With a stock trading plan, a stock investing system and stock trading software, scanning for trades becomes easier than ever to find that needle. The three pieces needed to identify successful trades are in place. And when the opportunity rolls around next time, the investor can stand up proudly at the Rolls Royce dealership and proclaim, ?I knew to buy stock in ABC Corp when it was only $1.00 per share!? right before driving away in that $125,000 Rolls he earned by scanning for trades the right way and putting in the effort to give himself a winning edge.


Market Direction

Candlestick signals provide a much clearer picture of what the overall market trend will be doing. The candlestick formations provide an immense amount of information. That information becomes very easy to analyze because of its visual nature. This past week, the markets showed a strong possibility that the sellers could be taking control. The big down day in both the Dow and the NASDAQ was confirmation. Was this a full scale reversal or was it profit taking? Analyzing the candle formations at important technical levels make trend analysis very easy to comprehend.

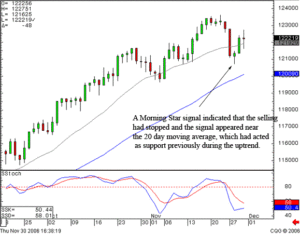
After the severe pullback in the markets, which could have led to more downside, the markets supported in an important level, the 20 day moving average. Why was this an important level? Because the uptrend of the past few months has been supporting on the 20 day moving average. The Morning Star signal over the past three days of trading in the Dow, right at the 20 day moving average, was a good indication that the Bulls were still participating in this trend.

Scanning for Trades Dow

Dow

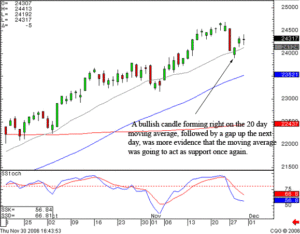
The small bullish candle in the NASDAQ, right on the 20 day moving average, provided easy analytical criteria for how the trend should continue. With the stochastics heading in a downward direction, the small bullish candle in the NASDAQ on Wednesday would have been considered merely a bounce after a big down day had prices continued lower the following day. The lack of support at the 20 day moving average would have simply revealed that the 20 day moving average was not acting as a support level anymore.

Scanning for Trades NASDAQ

NASDAQ

The fact that there was a gap up following a bullish candle the next day produced significant information. The buyers were stepping back in with enthusiasm. This provided reasonably good information that the sellers had not yet taken control of the trend. This is not sophisticated analysis. This is merely interpreting what the candlestick signals are telling us. If the Bulls were stepping in again, maintaining the uptrend, that should provide a good number of trade opportunities.

There are thousands of stock trade opportunities. How does an investor analyze which trades are going to have the best potential and how can that be done in a reasonable amount of time? Candlestick signals are very beneficial for cultivating down to the best possible trades. Knowing what is incorporated into each signal provides scanning formulas that make finding the strongest trades very easy.

The application of common sense scanning criteria provided by candlestick analysis creates a very simple trade process. What criteria can be added to the scanning analysis that continually puts the probabilities in the investors favor? What direction is the overall trend of the market? That can be easily analyzed using candlestick signals. What direction is a specific sector moving? That can also be easily analyzed using candlestick signals. What chart patterns or signals produce the highest potential of a strong price move? When all these criteria are put into simple scanning processes, a small number of high potential trades can be identified in a matter of a few minutes each day.
Will the scanning results put you into big profit trades? Not necessarily, but what the results from a candlestick scanning technique does provide is trade setups that have the potential for being big profit trades. The Dynavax Tech chart illustrates the simple logic involved with being able to identify candlestick reversal signals and applying that information with other technical parameters.

Scanning for Trades DVAX

DVAX

The Hammer type signal forming right on the 50 day moving average, a major potential support level, with stochastics in the oversold condition, followed by a gap up in price, makes for an extremely high potential/high profit trade situation. This position was recommended in our Candlestick Forum members’ area based upon the identification of a strong buy signal. Again, will the scanning results put you into big profit trades? The scanning results produce situations for participating in  high potential trades.

Understanding the psychology in  price trends becomes very important for participating in big profit trades. That psychology can be better interpreted when identifying and evaluating what the individual candlestick formations represent. Being able to evaluate what ‘might’ be occurring during a price trend, based upon the previous candle formations, such as inordinate strength, has a different potential result than a previous moderate uptrend. Learning how to properly use candlestick analysis is very easy. It is the common sense evaluation of what has occurred in investor sentiment during a price move millions of times in the past.

NEW RELEASE – Scanning Techniques to Higher Profits is now available on the website. This training CD provides an easy step-by-step process for creating effective scanning techniques. Additionally, the analytical process is incorporated into the evaluation of the highest potential trades for the next trading day. This powerful combination allows an investor to be participating in the potential big profit moves.

Click here to receive the Introductory Price Special on – Scanning Techniques to Higher Profits 

Chat session tonight open to everybody 8 p.m. ET – Stock Chat Instructions Here

Good investing,
The Candlestick Forum Staff

Candlestick Charting Techniques

Candlestick charting techniques have been around for over 100 years and began in Japan. Homma, a Japanese man discovered that the difference between the value and the price of rice was greatly influenced by the emotions of the rice traders. The principles that he established for rice trading are applicable to stocks as they are currently traded today. This formed the basis for candlestick chart analysis which is used to measure the market’s emotions towards stock. The idea behind candlestick charting is to take advantage of forecasted price direction change for any selected time period.

Japanese candlestick charts were developed before the bar chart and the point-and-figure stock charts were is use and they are still the preferable chart for most traders. Candlestick charts are considered to be more visually appealing and therefore are easier to read. These charts are also flexible because they can be used alone or in combination with other technical analysis tools. This provides a significant advantage for candlestick charting techniques over other trading techniques, and it provides an extra element of analysis.

To a technical stock trader, the importance of candlestick trading is that it explains the relationship between the opening and closing stock prices. This is the most important part of candlestick analysis. When the opening price is above the closing price the candlestick chart is typically referred to as the black candlestick and conversely when the opening price is lower than the closing price, a white candlestick will form. This is pretty easily distinguishable when looking at the candlestick chart.

There are two patterns that are pretty much the most basic candlestick patterns that are used in candlestick charting techniques, and they are called the doji candlestick and the bullish engulfing.

This doji candlestick is formed when the opening stock price and closing price are the same or very close. What this means in the market is that the bulls and the bears are conflicted and the investors must take action. The action the investor must take however depends on where it occurs in the trend. If it occurs at the bottom of an extended downtrend, the investor must look for buying signals to confirm the reversal. Conversely, when the doji appears at the top of a trend, in an overbought area, this indicates to the investor that he or she should sell immediately.
The engulfing candlestick pattern is a major reversal pattern made of two bodies that are opposite colors. The bullish engulfing pattern forms after a downtrend and it opens lower than the previous day’s close and it closes higher than the previous day’s open. As a result, the white (hollow) candle completely engulfs the previous day’s black candle. A white (hollow) candle is representative of a day when the close was higher than the previous day’s open, and the black candle represents a day when the close for the day was lower than the previous day’s close. 
There is a lot more to understanding candlestick charting techniques. Traders should learn first about the 12 major signals, and then they can move onto learning about the secondary candlestick patterns that are used in Japanese candlestick charting.


Market Direction

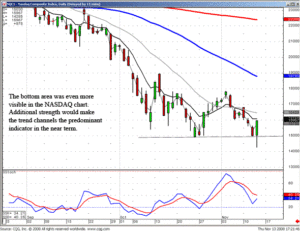
Knowing what each individual signal looks like allows for perfect timing when a reversal could potentially occur. This was illustrated in the Dow chart as well as the NASDAQ chart today. What constitutes the definition of where a reversal could potentially occur? At any level that can be conceived by many investors as a support or resistance level. Yesterday the NASDAQ closed right on the recent lows. The Dow chart was approaching that same area. Stochastics were not quite to the oversold level, but they were getting relatively close. With the setup of these indicators, two assumptions could be made. The current lows could act as a support level or if the current lows were breached with a strong bearish candle today, wave three was then in progress.

Candlestick Charting Techniques, NASDAQ

NASDAQ

The early-morning trading started the markets off in a negative direction. The Dow was down at least a couple hundred points in the morning. The NASDAQ was trading in new low territory. The Dow was showing considerable weakness. An aggressive trader, knowing there was the possibility of supporting at the recent previous lows, can be prepared for a potential candlestick signal. Around midday, buying started to show up. At that point, aggressive traders or daytraders should switch their concentration onto shorter-term charts, the 10 minute chart, a 30 minute chart, or the hourly chart. As the afternoon progressed, it was obvious that at least a Hammer signal was forming. That potential reversal signal is a new evaluation on the plate. Going into the latter part of the day, with a reversal signal forming, would have made it more obvious that these levels were acting as support. This should have instigated the covering of short positions.

What has the market been previously telling us? In the current downtrend, any late afternoon buying was followed by more selling. As Thursday  afternoon progressed, it became obvious that no selling pressure was coming back into the market. This made projecting the candle formation fairly easy. It was going to be at worst a long-legged Doji. Probably a Hammer signal. Better yet, a Hammer/Harami signal. It finally closed as a booster Bullish Engulfing signal. This is a very strong signal bouncing off an obvious support level.

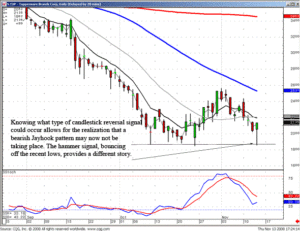
The question often arises, when is it time to cover short positions, or long positions for that matter. The best answer is when you can easily assess that there has been a change of investor sentiment at an obvious support level. If individual position can be seen to be setting up to form a potential reversal signal, closeout the positions. This could be seen in our recommendation today in the TUP chart. It was just about ready to break down through recent low areas. Had it closed near the low end of the trading range today, it would have been a set up for a bearish Jayhook pattern. However, with the price coming back up near the  top end of the trading range of the day, it was potentially forming a Hammer signal, near the recent lows. Knowing what type of signals a price-move might be forming allows for much quicker decisions for when to get out of positions and be ready to establish positions in the opposite direction.

Candlestick Charting Techniques, TUP

TUP

This is not difficult or involved technical analysis. This is taking the information that is built into each candlestick signal and applying it for the appropriate times to be getting in and out of trades. The visual aspects of candlestick signals allows for that extra anticipation of what type of signal could be forming. Take advantage of the visual aspects of these valuable trading tools. Using them correctly will definitely increase your profitability and reduce the emotional decision-making.

Good investing,
The Candlestick Forum Team

S&P 500

The S&P 500 stands for Standard and Poor’s 500 Index and it is one of the most commonly used benchmarks of the U.S stock market. It consists of 500 companies that are extremely diverse in relation to their industries and these companies are chosen by the S&P Index Committee. The 500 companies that exist on this index are not simply the largest 500 companies but instead are actually chosen by the committee for a variety of reasons. These reasons include their market capitalization, revenue, liquidity, and sector representation in the stock market community. The team of analysts referred to as the S&P Index Committee also looks at factors such as the market value weighted index, meaning that the weight of each stock in the index is proportionate to its market value. Basically, the companies on this index are the leading companies in leading industries.

The S&P 500 is meant to be the leading indicator of the U.S. equities and to show the risk and return characteristics of the large cap universe (see large cap stocks). It represents about 70% of all the U.S publicly traded companies and part of what made it so renowned is the Vanguard 500 Index fund. This index fund is the largest of the mutual funds in the entire world. This index of 500 is also popular as a result of the first exchange traded fund (ETF), Spiders (AMEX: SPY), as well. These new exchanged traded funds are becoming more and more popular due to the lower expense ratios. There are also a small number of international companies that are included on the S&P 500 however the Standard and Poor Index Committee has stated that it will only continue to add United States based companies to the index in the future.

The Dow Jones Industrial Average (DIJA) used to be the most popular index for U.S. stocks. Most people however agree that the Standard & Poor’s 500 Index is a much better representation of the stock market in the United States. Additionally, the Dow Jones Industrial Average only contains 30 companies which is a smaller representation. There are also other Standard & Poor’s indexes such as the S&P 600. This index consists of small cap companies (see small cap stocks) with market capitalizations between 300 million dollars and 2 billion dollars. In addition to the S&P 500 is the S&P 400 which consists of mid cap companies with market capitalizations ranging from 2 billion dollars to 10 billion dollars.


Market Direction

What is one of the most powerful elements of candlestick signals? The visual depiction of what is occurring in investor sentiment right now. “Right now” can relate to a one minute chart as well as a daily chart. The added information provided by the open and close each day/time frame is extremely important. It is a trading techniques that has been refined for many centuries. This is a huge advantage over trying to learn investment techniques that have recently been discovered. A proven trading method passes the test of any market/trend conditions. It allows for accurate evaluation of a trend reversal as well as the analysis of when a trend will continue. Having the confidence that candlestick analysis works effectively allows for the continuation of its refinement. Candlestick analysis provides  all of the above.

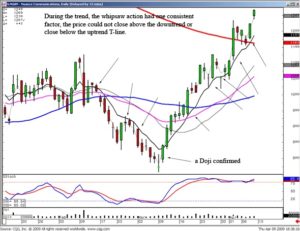
What is the T-line? This question is often asked in many of our chat training sessions. It is merely the 8 exponential moving average. A major advantage provided by the trading chat room on the website is the exchange of ideas for improving someone’s trading technique. The 8 exponential moving average has very consistent analytical features. Rick, who has utilized candlestick analysis for many years, has discovered other trading indicators that greatly enhance the probabilities of being in the correct trade at the correct time. He discovered the use of the T-line allowed for much more accurate transactions for entering or exiting a trade as well as continuing to hold during a trend. This is just one of the indicators that has allowed him to produce a very successful day trading career.

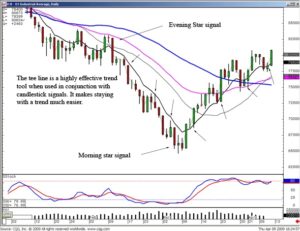
Candlestick analysis illustrates what is occurring in investor sentiment. Candlestick reversal signals represent a change of the previous investor sentiment. The longer a trend continues in a specific direction, the more compelling the reversal signal needs to be to show there has been a change of investor sentiment. The T-line acts as a very powerful indicator to demonstrate the continuation of investor sentiment or the confirmation of a change in investor sentiment. A trend has inherent forces that make it move in a specific direction. Until these forces are completely altered, the trend will remain consistent in a specific direction. As illustrated in the Dow chart, the recent downtrend evaluation was consistent with the trend remaining below the T-line. A Morning Star signal at the bottom indicated the confirmation of a reversal with prices closing above the tee line. This made the uptrend evaluation very simple. The uptrend would continue until a candlestick reversal signal and bearish confirmation below the T-line was experienced.

DOW

DOW

There will be ‘down’ days in an uptrend. There will be up days in a downtrend. However, unless a reversal signal is confirmed, the simple rules applied to the reversal signals and the tee line will keep investors in a position until a true change of investor sentiment has occurred. The major problem most investors experience involves their own emotions. When do I take profits? Not to take profits and give back hard-earned gains is one of the biggest fears for investors. Candlestick analysis eases the process. Applying simple rules with the signals and the trends dramatically reduces the anxiety most investors experience. Cut your losses short and let your profits run! Much easier said than done. Learning how to properly use candlestick signals and confirming indicators greatly reduces the possibilities of being left behind during a strong uptrend.

S&P 500, ES Comparison

ES

S&P 500, NUAN Comparison

NUAN

The candlestick rice traders took advantage of the information conveyed in candlestick analysis. Their processes greatly reduce the emotions involved with investing. If you use signals/patterns correctly, you wiii not be exposed to emotional forces that tug at most peoples investment decisions. This is true for the beginning investor as well as a seasoned trader. The more emotions can be taken out of investing, the more rational thought processes can help exploit consistent and large profits from the markets. Candlestick signals are proven. Learn how to use them correctly, your rate of return will grow dramatically.

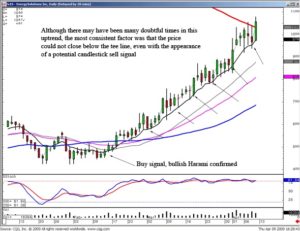
As seen in the Dow chart, there has not yet been a candlestick signals with a significant close below the tee line. The uptrend still remains in progress until that simple combination appears. Remaining in positions, especially the financial stocks, using a simple rule produce huge profits on Thursday. BAC was up 35%, FITB was up 30%, FAS was up 40%. The financial stocks had been recommended on the candlestick forum for the past few weeks. Maintaining positions to eventually participate in big profit moves is made much easier when applying the tee line to the evaluation.

Public Chat Session tonight at 8 PM ET – it will be an abbreviated session so everybody can enjoy the long weekend.

Good investing,
The Candlestick Forum Team

Candlestick Trading Forum – Free Stock Market Newsletters

Don’t miss out on Free Stock Market Newsletters and trading with Japanese Candlesticks by Stephen W. Bigalow, author of Profitable Candlestick Trading and High Profit Candlestick Patterns.

Learning the stock market just got easier! The stock market for beginners can be overwhelming. Investing in the stock market involves technical analysis of stock charts. More individual investors are turning to candlestick charts for day trading and long term market analysis.

Timely market advice provided completely free of charge or obligation!

Sign up for the no cost, no obligation, and no risk Candlestick Forum Newsletter – Simply enter your email into the  Free Newsletter Box located at the top right side of this page and you will receive your free e-book “12 Signals to Master Any Market”

These newsletters are filled with valuable information delivered directly into your mailbox. To sign up, enter your email address in the newsletter sign up box provided on the lower left-hand box and click the submit button. IMPORTANT NOTICE – To ensure your ISP does not block our newsletter delivery – Click Here

By subscribing, you will receive weekly newsletters. Our free stock market newsletters do not contain adware or spyware and you can unsubscribe at any time. Its worth the try!

Your email address is kept strictly confidential and will never be sold, traded, or shared with any third party.
Free Stock Market Newsletters – Topics Covered:

Market Comments

The publication utilizes the capabilities of the Candlestick signals to quickly analyze all investment vehicles. Stephen W. Bigalow’s years of Candlestick analysis experience produces an easy to read, concise evaluation of market direction. Accurate evaluations are assessed to the Dow, the NASDAQ, S&P, bonds, metals, currencies, and all market entities that allow an investor to project future price movements. Having this knowledge presented in a clear format allows the investor to formulate concise decisions.

Candlestick Signal Descriptions

Learn how the signals identify the big price moves. Read about the psychology behind a  price move attributed to the strength of a signal. Each free stock market e-zine newsletter will include interesting and profitable elements of a signal formation. You get valuable insights into why a price move occurred. This acts as an excellent preparation for identifying the next big profit situation.

Current Events

Stay up to date with the latest Stock Market Exchange Holidays, which often cause lower trading volume around the dates the market closes for recognized stock market holidays. Follow how situations in the news media can affect your profits, profits created by media reports causing panic selling and exuberant buying provide excellent profit taking opportunities. Stay apprised of government and business decisions.

Helpful Hints

All newsletters are sent from the domain “candlestickforum.com.” Please use this domain name when configuring email or spam filter rules if you use them. We suggest all subscribers using AOL add us to their allowed list. Don’t let future newsletters get trapped in your spam filters. Who knows, perhaps one of these articles will change your financial future.

Need to receive multiple subscriptions? Just enter all the email addresses you wish to receive our newsletter, one at a time of course. (i.e. home, office)

Need to change your address? Simply email admin@candlestickforum.com with your new and old email address.


Ready to begin your Japanese Candlestick Education? May we suggest beginning with 
Understanding Candlestick Charts and Candlestick Images & Explanations 

Stock Investing for Beginners – Made Easy with Candlestick Signals

Stock investing for beginners can be overwhelming in the beginning. The huge amounts of information available on the Internet make trying to cultivate the right information very difficult.

Stock investing for beginners requires a focused plan. Correctly learning candlestick signals greatly simplifies the learning process. Not only do the signals illustrate when a change of investor sentiment has occurred, learning what was the investor sentiment that created the signal is an important educational tool.

Stock investing for beginners usually involves finding the stocks that are going up. Unfortunately, most investors do not research why those positions should be going up. Chasing after the rumors or the hot stock stories is usually the wrong stock-investing process. But it seems to be the most enticing. However, it does not create a platform for when and why the next position should be moving. The candlestick signals provide an immense amount of information. A candlestick signal is formed by specific dynamics of investor perspective.

Candlestick analysis is based upon  reoccurring thought processes from inexperienced investors all the way through to the seasoned traders.  The signals are the cumulative knowledge of everybody buying and selling during a specific time- period. Having the ability to quickly recognize what is occurring in investor sentiment creates huge advantages.  Stock investing for beginners should not be made difficult.  It should be an easy learning process.  The Candlestick Forum is a very strong advocate of teaching kids how to invest and we welcome them to all our stock market training seminars.  Teach your kids how to invest during their learning years.  Once they get to the age to where they ‘need’ to be investing, they will not be making the common mistakes most of us make when getting our feet wet in the markets. They will now be learning to improve their investment techniques.

The 12 major candlestick signals incorporate common sense investment techniques.  Simplify the process. Learn these 12 major signals and the reasons for market direction changes can be easily understood. Click here to review the 12 major CD special.

Basics of Futures and Options Trading

Basics of Futures Trading
Futures Trading for Beginners
Paper Trading Futures
Futures Trading
Futures Markets
Trade Futures
Futures Trading Plan
Futures Orders
Futures Analysis
Futures Exchanges
Futures Trading Advisors

Basics of Options Trading
Options Trading for Beginners
Paper Trading Options
Options Trading
Options Markets
Trade Options
Options Trading Plan
Options Orders
Options Analysis
Options Exchanges
Options Trading Advisors

Doji and Gap Combinations = Power Profits, Stocks & Commodities Magazine

The Doji is one of the most revealing signals in Candlestick trading. It clearly indicates that the bulls and the bears are at an equilibrium, a state of indecision. The Doji appearing at the end of an extended trend has significant implications. The trend may be ending. Just this fact alone creates a multitude of investment programs that produce inordinate profits. What is the best method for making big trading profits? Knowing the direction of a trading entity and the strength of that move. Candlestick analysis perfects that trading strategy. Candlestick formations reveal high probability profitable reversals. Hundreds of years of investing refinement has proven that point.

The Japanese say that whenever a Doji appears, always take notice. A well-founded rule of Candlestick followers is that when a Doji appears at the top of a trend, in an overbought area, sell immediately. Conversely, a Doji seen at the bottom of an extended downtrend requires buying signals the next day to confirm the reversal. Otherwise, the weight of the market could take the trend lower.

What could be better than knowing which way a market or a trading entity is going to move? One additional important element! How powerful is that new move going to be? A powerful indication that a strong trend is beginning is the appearance of a “window” or gap. Gaps (Ku) are called windows (Mado) in Japanese Candlestick analysis. A gap or window is one of the most misunderstood technical message. It is usually advised by a good percentage of investment advisors to not buy after a gap. This is very bad advice. The gaps will reveal powerful high profit trades. Candlestick signals, correlated with the appearance of a gap, provide valuable profit making set-ups.
The ramification of a gap pattern is an important aspect to Japanese Candlestick analysis. Some traders make a living trading strictly off of gaps. Dissecting the implications of a gap/window makes its appearance easy to understand. Once you understand why a gap occurs in different locations in a trend, taking advantage of what the gaps reveal becomes highly profitable. Where a gap occurs is important.

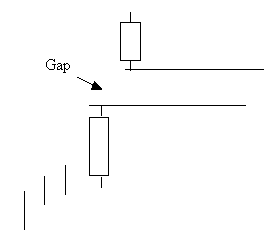
Consider what a window or gap represents. In a rising market, it illustrates prices opening higher than any of the previous day’s trading range. What does this mean in reality? During the non-market hours, something made owning this stock tremendously desirable. So desirable that the order imbalance opens the price well above the prior day’s body as well as the high of the previous day’s trading range (the same is true for a bearish indication, gapping down from the previous range). As seen in Figure 1, note the space between the high of the previous day and the low of the following day.

ISSI Gap Trading

Gap Formation

Witnessing a gap or window at the beginning of a new trend produces profitable opportunities. Seeing the gap formed at the beginning of the trend reveals that on a reversal of direction, the buyers have stepped in with a great amount of zeal. A common scenario is witnessing a prolonged downtrend. A Doji appears, indicating that the selling may have stopped. To verify that the downtrend has stopped, indication of buying the next day is required. This can be more pronounced if the next day has a “gap” up move.

Many investors are apprehensive about buying a stock that has popped up from the previous day’s close. A risky situation! Yet a Candlestick investor has been forewarned that the trend is going to change, using a signal as that alert. A gap up illustrates that the force of buying in the new upward trend is going to be strong. The enthusiasm shown by the buyers trying to get into the stock demonstrates that the new trend should have a strong move to it. Use that gap as a strength indicator.

Doji and Gaps at the Bottom

Knowing that a gap represents an enthusiasm for getting into or out of a stock position creates the forewarning that a strong profit potential has occurred. Where is the best place to see rampant enthusiasm when you are buying? At that point you are buying, near the bottom. Obviously, seeing a potential Candlestick buy signal at the bottom of an extended downtrend is a great place to buy. In keeping with the concepts taught in Candlestick analysis, we want to be buying stocks that are already oversold to reduce the downside risk. What is even better is the evidence that buyers are very anxious to get into the stock.

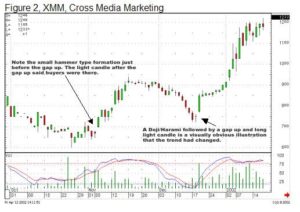
Note in Figure 2, XMM, Cross Media Marketing, after Doji/Harami’s, one on November 5th, another on December 18, 2001, that the gap up the next day clearly indicated that the trend had stopped. The resulting trades produced 28.5% and 49.3% respectively. Probabilities demonstrate that a gap up is going to preclude an advance in price under these circumstances. Unofficially, candlestick statistics illustrate an 80% and better probability that a trade will be successful when stochastics are oversold, a Candlestick buy signal appears, and prices gap up. (The Candlestick Trading Forum provides candlestick statistics that they represent as unofficial. Even though over fifteen years of observations and studies have been involved, no formal data gathering programs have been fully operated. However, currently the Candlestick Trading Forum is involved with two university studies to quantify signal results).

XXM Gap Trading

XXM Gap Trading

Having this statistic as part of an investors arsenal of knowledge creates opportunities to extract large gains out of the markets. The risk factor remains extremely low when participating in these trade set-ups.

Many investors are afraid to buy after a gap up. The rationale being that they don’t like paying up for a stock that may have already moved 3%, 5%, 10% already that day. But this rationale is unimportant to the Candlestick investor. Witnessing a Candlestick buy signal prior to the gap up provides a basis for aggressively buying the stock. If it is at the bottom of a trend, that 3%, 5%, 10% initial move may just be the beginning of a 25%, 30%, 40% move or a major trend that can last for months.

Doji and Gaps at the Top

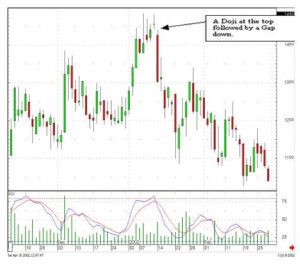
Gaps and windows reveal a strong force in a direction whether it is bullish or bearish. The Candlestick signal is the prime factor for looking for a reversal. A gap down after a sell signal verifies that the signal was effective. The Japanese say that a Doji at the top of a sustained trend warrants immediate liquidation. That becomes more evident if the prices gap down the next day. Note in Figure 3, ISSI, Integrated Silicon Solutions, the Doji at the top, with stochastics in the overbought area, would have been the warning. If investors were long, upon seeing the Doji, they should liquidate at the first sign of a weaker open. The gap down the next day would have been more than enough to convince the Candlestick investor that the sellers had stepped in.

ISSI Gap Trading

ISSI, Integrated Silicon Solutions

The investor that does not utilize the information revealed by gaps/windows is leaving massive profits for somebody else. Just as the Candlestick signals have different meanings at different points in a trend, the gaps have different messages at certain points in a trend. The Candlestick signals, signals that have imbedded information in their formation, combined with a gap/window, also a signal that implies a magnitude of buying or selling interest, creates one of the most powerful investment tools found in technical analysis. The major function of technical analysis is to find trade patterns that put probabilities highly in our favor. Hundreds of years of profitable observations have identified the Doji as a prime reversal signal. Gaps have demonstrated many times over that they are the driving force of a trend direction. The combination of these two indicators produce profits that cannot be ignored.

Training Tutorials
Gap Trading