Archives for September 2019

Trading Hot Stocks

Investors and traders can profit from picking stocks that are hot. But, how does one go about trading hot stocks? One problem in long term investing is that by the time a stock is hot it has commonly risen to a high price to earnings ratio or price to sales ratio or fallen dramatically. A hot stock rises in price as the stock market discounts its intrinsic stock value or falls on poor earnings reports. Good stock picks in long term investing are overlooked stocks. The smart long term investor or the day trader picks these stocks and sells them when they become hot stocks. Trading hot stocks is a different matter. Trading hot stocks has to do with stocks that are currently popular, falling or rising in stock price, and which often present with high trading volume and stock volatility. Candlestick stock charts are the tool of choice of many who trade hot stocks. Technical analysis of stocks with Candlestick analysis gives traders an objective view of market sentiment and easy to read signals up which to act.

Hot stocks recently include Boeing with increased sales, Amazon with earnings that did not fall as much as anticipated, and Allegheny Technologies whose earnings went up 70% while the stock fell 3% because analysts had expected better. In these types of situations traders buy stock or sell stock based upon their expectations of adjustments in stock prices. There is typically a short period of market inefficiency as traders and investors decide how to price a stock based upon both new information, and more importantly, new expectations. In trading hot stocks with Candlestick patterns a trader reacts to signals that predict the next movements of stock prices. Easy to read Candlestick signals give traders an objective appraisal of what the market as a whole is thinking about an individual stock or stock index. Candlestick signals work for trading hot stocks directly and for options trading and futures trading of hot stocks as well.

Depending upon what made a stock hot, its period of high trading volume, high stock volatility, and stock trading opportunity may by just a few hours or may last for days, weeks, or months. It will depend upon how long it takes for the market to reach a consensus on the value of the stock in question. In all stock trading it is important for the trader to have a clear idea about the fundamentals that drive a stock price. Then the trader knows the general range in which a stock will trade and the general factors that will affect price. However, it is with technical analysis tools such as Candlestick patterns that traders can profit most from trading hot stocks. These stocks can change price rapidly and reverse in price quickly. With the use of Candlestick signals a trader can successfully and profitably anticipate price changes. In the very short term the Candlestick trader is able to objectively read the market and avoid the mistakes of getting carried away with market enthusiasm or disappointment. No matter what the market is doing it has done it before. Price patterns repeat themselves and Candlestick signals allow traders to profit from that fact when trading hot stocks.


Market Direction

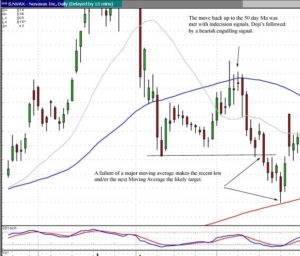
This market would be terrible IF you were not short. However, candlestick analysis is a very effective trading method for making sure your portfolio is in the right direction at the right time. As seen in our pre-market comments, the first suggestions of adding short positions to the portfolio started over two weeks ago, not because there was any great foresight into the coming downtrend, but because there were a candlestick sell signals at obvious resistance levels. Utilizing the simple rules applied to candlestick signals would now have a portfolio positioning predominantly short.


Please join us tonight with our guest speaker been Adrienne Toghraie. Gain some insights and how to overcome some of the emotions of investing. This is an important element in learning how to use a trading method effectively and then how to mentally control your emotions.

Chat session tonight at 8 PM ET, Everyone is welcome!
Make sure you check out the commodity trading special. Knowing how to trade commodities correctly, especially with candlestick analysis, allows an investor to trade markets profitably and be able to analyze the results of one market based upon the price movement of specific commodities. You do not like or know how to short stocks? That is a good reason to understand the commodity and currency markets. The visual graphics of candlestick analysis allow an investor to make profits in spite of what one market might be doing. Today, there were huge profits made by investing in the US dollar. That became evident that as stock investors worldwide were becoming less confident, the US dollar became a haven for the insecurity throughout the investment world. Click here for the commodity trading special.

The Candlestick Forum Team


Website Special

5 Star Trading Plan With 30 Day Free Membership Trial – 25%OFF!!

Website special reflects current newsletter. If you are reading an archived newsletter you will be directed to Current Website Special

Common Options Trading Terms

Ask Price

The price at which a seller is offering to sell an option or stock.

Assignment

The receipt of an exercise notice by an option writer (seller) that obligates him to sell (in the case of a call) or purchase (in the case of a put) the underlying security at the specified strike price.

At-the-money

An option is at-the-money if the strike price of the option is equal to the market price of the underlying security.

Automatic Exercise

A protection procedure whereby the Options Clearing Corporation attempts to protect the holder of an expiring in-the-money option by automatically exercising the option on behalf of the holder.

Bearish

An adjective describing an opinion or outlook that expects a decline in price, either by the general market or by an underlying stock, or both.

Bear Spread

An option strategy that makes its maximum profit when the underlying stock declines and has its maximum risk if the stock rises in price. The strategy can be implemented with either puts or calls. In either case, an option with a higher striking price is purchased and one with a lower striking price is sold, both options generally having the same expiration date.

Beta

A measure of how a stock’s movement correlates to the movement of the entire stock market. The Beta is not the same as volatility.

Bid Price

The price at which a buyer is willing to buy an option or stock.

Box Spread

A type of option arbitrage in which both a bull spread and a bear spread are established for a near-riskless position. One spread is established using put options and the other is established using calls. The spread may both be debit spreads (call bull spread vs. put bear spread) or both credit spreads ( call bear spread vs. put bull spread). Break-Even Point–the stock price (or prices) at which a particular strategy neither makes nor loses money. It generally pertains to the result at the expiration date of the options involved in the strategy. A “dynamic” break-even point is one that changes as time passes.

Bullish

Describing an opinion or outlook in which one expects a rise in price, either by the general market or by an individual security.

Bull Spread

An option strategy that achieves its maximum potential if the underlying security rises far enough, and has its maximum risk if the security falls far enough. An option with a lower striking price is bought and one with a higher striking price is sold, both generally having the same expiration date. Either puts or calls may be used for the strategy.

Butterfly Spread

An option strategy that has both limited risk and limited profit potential, constructed by combining a bull spread and a bear spread. Three striking prices are involved, with the lower two being utilized in one spread and the higher two in the opposite spread. The strategy can be established with either puts or calls; there are four different ways of combining options to construct the same basic position.

Call

An Option contract that gives the holder the right to buy the underlying security at a specified price for a certain, fixed period of time.

Cash-Based

Referring to an option or future that is settled in cash when exercised or assigned. No physical entity, either stock or commodity, is received or delivered.

Cash Settlement

The process by which the terms of an option contract are fulfilled through the payment or receipt in dollars of the amount by which the option is in-the-money as opposed to delivering or receiving the underlying stock.

CBOE

The Chicago Board Options Exchange; the first national exchange to trade listed stock options.

Class

A term used to refer to all put and call contracts on the same underlying security.

Closing Purchase

A transaction in which the purchaser’s intention is to reduce or eliminate a short position in a given series of options.

Closing Sale

A transaction in which the seller’s intention is to reduce or eliminate a long position in a given series of options.

Closing Transaction

A trade that reduced an investor’s position. Closing buy transactions reduce short positions and closing sell transactions reduce long positions.

Combination

Any position involving both put and call options that is not a straddle.

Cover

To buy back as a closing transaction an option that was initially written.

Covered

A written option is considered to be covered if the writer also has an opposing market position on a share-for-share basis in the underlying security.

Covered Call

An option strategy in which a call option is written against long stock on a share-for-share basis.

Covered Call Option Writing

A strategy in which one sells call options while simultaneously owning an equivalent position in the underlying security or strategy in which one sells put options and simultaneously is short an equivalent position in the underlying security.

Covered Put Write

A strategy in which one sells put options and simultaneously is short an equal number of shares of the underlying security.

Covered Straddle

An option strategy in which one call and one put with the same strike price and expiration are written against 100 shares of the underlying stock.

Cycle
The expiration dates applicable to various classes of options. There are three cycles: January/April/July/October, February/May/August/November, and March/June/September/ December.


Return to Options Trading Main Page

If you did not find the term you were looking for here, you might try the CBOE  Chicago Board Options Exchange. They have a broad selection of option terms and trading tools.

Short Selling Optimized with Candlestick Signals

Many investors do not like short selling. There is the stigma that short selling induces negative connotations and is Un-American. However, short selling is a vital part of market movements. It provides liquidity and stability in price movements. Short selling is also extremely profitable. The anguish of watching long positions go down is completely reversed with the exhilaration of knowing those prices going down are producing profits. The markets go up and down. Having the ability to identify those directions permits an investor to make profits in any market conditions.

Short selling greatly enhances returns. Price patterns that work extremely well as bullish indicators perform just as well as bearish indicators. Candlestick buy signals in an oversold condition produce an extremely high probability of producing an uptrend. Conversely, candlestick sell signals witnessed in overbought conditions produce extremely high probability that a downtrend is going to occur. Those signals/patterns, occurring with other technical indicators such as trend lines and moving averages, dramatically increases those probabilities. Short selling, when a candlestick signal appears in an overbought condition and at a major resistance level such as a moving average, becomes a very easy trade set-up to identify.

Dave Elliott of WallStreetteachers.com has produced some very simple and powerful observable trading patterns for short selling. His Blue Ice Failure pattern is an extremely high probability trade. Wouldn’t you like to be able to identify high probability reversal situations? David Elliott’s extensive research in price patterns does just that! What makes these patterns that much more easily to identify? The use of candlestick signals. The combination of price patterns and candlestick signals produces trade situations with a great degree of accuracy.

Blue Ice Failure Pattern

The pattern is aptly named in that it represents somebody falling through the ice, (the trend coming down through a major moving average such as the 50 day moving average.) They try to swim back up to find the hole that they fell through. When they cannot find it, they sink to the bottom.

This pattern becomes very easy to identify using candlestick signals. After the prices come down through the first major moving average, it will try to attempt breaking up through that moving average again. The failure of that breakthrough is the primary indication that a Blue Ice Failure is in progress. As the price approaches the moving average, candlestick sell signals such as Doji’s, Spinning Tops, and Hanging Man or Shooting Star signals appear at that level. This becomes an indication that the Bulls are being stymied at this level by the Bears. Once the Bulls realize they are not going to break through the moving average, they start liquidating their positions. This provides more confidence for the Bears.

Short Selling, NVAX

NVAX

Always keep in mind that the targets are high probability targets; establishing a short position puts the probabilities in the investors favor. The first target will be a test and breach of the recent lows with an additional probability of testing the next major moving average. As can be seen in the SIFY chart, the failure of the 50 day moving average it is a good indicator for short selling.

Stock Market Strategies Use Candlestick Formats for High Profits

How to Trade the Bullish Harami.

Most stock market strategies involve complicated approaches and formulas. Candlestick analysis provides a platform for making stock market strategies very simple to implement. Unfortunately, most investors put money into the markets without any concern for stock market strategies. This not only skews many investors investment perceptions, it also delays the process for how to learn to trade the stock market correctly. Stock market strategies should be incorporated into an investors learning process from the very beginning.

Candlestick signals provide the information that can put investors on the right track from the beginning. Taking advantage of the investor knowledge incorporated into candlestick signals allows an investor to eliminate bad habits. Stock market strategies should involve investment programs that put the probabilities of being in a correct trade in an investor’s favor. To simplify the process, if an investor merely learns the 12 major candlestick signals, the correct investor habits will be much easier to implement.

Successful stock market strategies involve investment practices that can be accounted for and constantly improve. The 12 major candlestick signals provide a framework for establishing a high probability trades. They also convey to an investor when the investor sentiment is not working properly. Most stock market strategies pay little attention to procedures on losing trades. The candlestick signals provide an expected result. When they do not occur, losses can be cut short . Funds can then be moved on to high probability situations.

Utilizing the 12 major signals establishes a knowledge base for what should happen in the future. Knowing the investor sentiment that developed the signals provides a much better insight for investors to determine successful trade situations. The Bullish Harami is an example of visual statistic analysis. Upon witnessing a bullish Harami at the end of a downtrend, an investor has a good idea of what to expect. This major signal becomes a vital information packed analytical tool.

HARAMI

BULLISH HARAMI

Bullish Harami

Description

The Harami is an often seen formation The pattern is composed of a two candle formation in a down-trending market. The body of the first candle is the same color as the current trend. The first body of the pattern is a long body, the second body is smaller. The open and the close occur inside the open and the close of the previous day. It’s presence indicates that the trend is over.

The Japanese definition for Harami is pregnant woman or body within. The first candle is black, a continuation of the existing trend. The second candle, the little belly sticking out, is usually white, but that is not always the case. The location and size of the second candle will influence the magnitude of the reversal.

Criteria

  1. The body of the first candle is black, the body of the second candle is white.
  2. The downtrend has been evident for a good period. A long black candle occurs at the end of the trend.
  3. The second day opens higher than the close of the previous day and closes lower than the open of the prior day
  4. Unlike the Western “Inside Day”, just the body needs to remain in the previous days body, where as the “Inside Day” requires both the body and the shadows to remain inside the previous days body.
    For a reversal signal, further confirmation is required to indicate that the trend is now moving up.

Signal Enhancements

  1. The longer the black candle and the white candle, the more forceful the reversal.
  2. The higher the white candle closes up on the black candle, the more convincing that a reversal has occurred despite the size of the white candle.

Pattern Psychology

After a strong down-trend has been in effect and after a selling day, the bulls open the price a higher than the previous close. The shorts get concerned and start covering. The price finishes higher for the day. This is enough support to have the short sellers take notice that the trend has been violated. A strong day the next day would convince everybody that the trend was reversing. Usually the volume is above the recent norm due to the unwinding of short positions.

Learning the 12 major signals makes the analysis of market trends and price trends very easy. They use of candlestick charts greatly enhances the speed in which somebody can analyze a trend correctly. The candlestick patterns are graphic statistical analysis. Japanese Rice traders have successfully use the signals for centuries. Learning how to invest in the stock market becomes much easier when you got the probabilities put in your favor.

Fundamental and technical analysis is greatly enhanced when using candlestick signals

Fundamental and technical analysis can work in conjunction for finding the best possible trades.  The combination of fundamental and technical analysis provides a very viable universe of high quality trades when applying candlestick signals.  Consider the advantages that occur when both fundamental and technical analysis is utilized for investment decisions.  What should be the best universe of stocks?  Those stocks that have a fundamentally sound background.  There are analysts out there that discover and recognize fundamentally strong companies.

Unfortunately, they feel that buying and holding is the best investment strategy.  The rationale being that a fundamentally sound company will eventually be discovered by the rest of the market. That usually means their timing stinks.Candlestick signals have a very viable benefit to the combination of fundamental and technical analysis.  If a universe of stocks is developed with the criteria being that they are fundamentally strong companies, this greatly reduces the probabilities of being surprised with bad financial numbers.  However, being in a fundamentally sound/strong company does not necessarily mean a stock price is going to appreciate.  What makes prices move up or down?  The perception of what the fundamentals can do is what makes prices move.

Utilizing candlestick signals is a very strong benefit for investing in fundamentally sound companies. The signals illustrate when investors are getting into and out of stock positions. Fundamental and technical analysis should be exploited to its fullest potential.  Analyzing the universe of fundamentally sound companies with candlestick signals allows an investor to time their positioning in strong companies.  Theoretically, all sound/strong fundamentally run companies should go up.  Reality proves differently, as seen in the late 1990s, money did not flow into the fundamentally sound companies. Massive amount of funds flowed into companies that had no fundamentals at all.

When is it time to buy a stock? It is when the markets perceive that it is time to be in that stock/sector. The candlestick signals clearly illustrate when funds flow from one sector to another.  Utilizing the information conveyed from the candlestick charts can produce a very strong trading strategy when trying to time the purchase of stocks that have good management/earnings growth. Investor sentiment can be easily recognized when interest starts coming into a stock position. The signals and the patterns found in investor sentiment will always be the same.  The ability to recognize candlestick signals within these patterns dramatically improves an investor’s probability for making profits.  The Candlestick Forum has packaged the high profit patterns into a special price package.

The visual analysis, when utilizing these signals, is very simple.  High profit trades become easily recognized, especially when candlestick signals reveal the potency of a pattern. Click here for details on the Advanced Pattern Analysis Package.

Option trading

Once the patterns and signals reveal a high potential trade, being able to maximize the profits from that trade, is the next logical step. Options strategies become the logical process for extracting very large profits. Knowing what option strategy to implement for the time and magnitude that a price move can potentially fulfill requires the understanding of profitable option strategies.  Learning the correct option techniques greatly enhances an investor’s ability to exploit profits from a strong candlestick signal while at the same time minimizing risk exposure.

Options University provides an excellent training program for implementing options strategies. The minimum time and effort that it takes to become educated from the Options University training program allows an investor to extract large profits from the markets. Combining the knowledge of candlestick analysis with the insightful knowledge conveyed by Option University puts investors in the position of controlling their own high profit strategies for the rest of their lives.

Bear Call Spread – Bearish Options Trading Strategy

Bear Call Spread is a stock market strategy employed when the market is extremely volatile and moderately bearish. Because of the erratic movements in a bear market, an investor will, in many instances, look to make moves that are profitable, yet hold low risk. The Bear Call Spread, also known as the Bear Credit Spread, is just such a technique that successful traders use in times such as these.

The stock option trading strategy for a Bear Call Spread is as follows. A trader sells a call option at one strike price and buys a call on the same asset which is further out-of-the-money (at a higher strike price). In most cases, both options will have the same expiration date. The profit and loss strategy for a Bear Call Spread is quite similar to a Bear Put Spread; however with this technique; the trader immediately receives a net premium when establishing the position. In a Bear Put Spread, the premium is paid when the position is established. Because of this difference, the investor already has money in hand at the inception of the Bear Call Spread.

The Bear Call Spread is lower risk than the Bear Put Spread; however, the profit potential is lessened as well. In a Bear Call Spread, the risk is minimized because the investor purchases lower priced calls that are protection if the price goes up significantly. Conversely, in a Bear Call Spread, profit potential is limited to the premium collected for the calls sold, less the cost of the premium paid for the calls that were purchased. As the name implies, this strategy is used in a bearish market, unlike the Bull Call Spread, which is employed when the market has become bullish.

A Bear Call Spread is a perfect example of successful trading. When an investor, through stock market technical analysis, realizes the presence of a bear market, it is imperative to modify the stock investing system. A bull market brings more opportunities for profitable trading; a bear market typically moves a trader into a more conservative approach of minimizing risks and finding trades that, while lucrative, are less risky. A Bear Call Spread is a perfect example of such a conservative move to find profits.

During a bearish period of trading, it is necessary for the investor to follow his, or her, stock trading plan. This requires solid stock technical analysis, stop loss strategies, and utilization of a stock trading system such as Japanese Candlesticks. This system, which has more than 200 years of success, helps the investor to evaluate the data obtained through technical analysis. Japanese Candlesticks is invaluable, especially in bearish times, as it assists the trader in drawing conclusions about the movements of the market.

A Bear Call Spread is one technique that an investor can use to find profits during an especially bearish market or a market experiencing volatility. Through technical analysis tools and learning how to read stock charts, a trader can focus on making money even when the market wants to take money from its investors.

Return to main Options Trading Category

Candlestick Day Trading

A common perception of Candlestick analysis is that it applies to day by day trading or even longer time frames. However, Candlestick day trading is possible by simply shortening the Candlestick time frame. While one can construct Candlestick stock charts based on a monthly, weekly, or daily time frame traders also use Candlestick charts based time frames of as little as an hour or even five minutes. Candlestick patterns have provided profits for traders ever since the days of the Samurai in ancient Japan. Because commodity , options, and stock price patterns repeat over time it is possible to use the front part of the pattern to predict the back half. Candlestick signals are based upon market experience thus it is just as possible to use Candlestick pattern formations to predict very short term stock price movement as it is to predict longer term movement. A day trader can search for market volatility in stocks and then follow the stock in Candlestick day trading in order to predict market trends , market reversal , or the next market rally.

Candlestick day trading works much like other types of day trading based upon technical analysis . The market tends to rapidly discount fundamentals as they become known. Thus traders use fundamental analysis to remain aware of the general limits and eventual direction of stock prices but use technical analysis tools to direct minute by minute trading. Because of the ability of Candlestick signals to illuminate market sentiment in both long and short time frames day traders use a modern version of an ancient rice trading technical analysis tool to successfully trade stocks online . Using Candlestick trading techniques on a daily basis allows the trader to insulate himself against the twin trading psychology demons of fear and greed. Because Candlestick day trading is statistically based it offers the trader high probability choices and not psychologically confusing stock tips or stock market news.

Candlestick day trading uses signals such as the Doji Candlestick. When upward or downward market trends are about to reverse there is often a period of confusion in the market. Some traders expect the trend to continue and place trades in the direction of the trend and others place trades in the contrary direction. Fundamentalists commonly bring the stock price back to the starting point at the end of a time period such as a day or even less. The Doji Candlestick is a good means of identifying market indecision. It is a very short candlestick with, often, very long shadows. This candlestick reflects the fact that a stock may be trading up and down from a base price but keeps returning to that price, as the market is confused. In Candlestick day trading this candlestick indicates that a now-confused trend is about to reverse. Using the Doji Candlestick and other Candlestick pattern formations a trader can succeed in Candlestick day trading as well as in trading stocks in the longer term.


Market Direction

The trend is your friend! That is usually a truism that works fairly consistently. The reason is relatively simple to analyze. Investor sentiment will continue to move in the same direction as long as there is no need to change. That was relatively evident in the past few days of trading. The Dow could not break up through the T-line. The NASDAQ formed a potential reversal signal but was not confirmed.


BOOK ERROR contest – if you have been keeping track of the occasional flaws that you may have found in Profitable Candlesticks  “Eliminating Emotions with Candlestick Analysis”, the ‘find the error contest’ will be handing at the end of this week. Prizes will be plentiful!

Introduction To Commodity Trading – June 15 8 PM ET – Learn the basics of commodity trading with candlestick signals. Learn the different methods of trading for commodities versus stock trading. Join during the summer special rate of $68.00, discounted from the normal rate of $127, and members are free.

Chat session tonight at 8 PM ET.

The Candlestick Forum Team


Website Special
Commodity Trading Mini Web – ON SALE!!
Website special reflects current newsletter. If you are reading an archived newsletter you will be directed to Current Website Special

Technical Analysis Software

When deciding which technical analysis software you would like to use you may find that many investors are combining technical analysis and fundamental analysis when investing in stocks and other financial securities. While many investors feel strongly about one using only one type of analysis, there are those investors who practice fundamental analysis, who may utilize some of the tools available with technical analysis software.

Some of the technical analysis methods that the fundamental trader may use include volume trends and indicators. Trading volume is one factor that helps investors to gauge market sentiment. Large spikes suggest to investors that a stock has gotten a lot of attention from the trading community and that the shares are under distribution or accumulation. There are popular volume indicators used in volume trading that help the investor to confirm whether or not other investors agree with the perspective of a security. A sudden decrease in volume can suggest to traders that interest has been lost and that a reversal may be on its way. Technical analysis software that is helpful with this includes intraday charting (see intraday trading). This type of charting is popular because it helps traders to watch for spikes in volume.

Other ways that fundamental traders will use technical analysis tools include tracking reactions over time. Fundamental traders will look at a chart of a specific stock, industry, market, or index in order to determine how that entity has performed over time. Patterns have a tendency to repeat themselves and investors react to in similar manners over time. Through analyzing historical trends, stock investors can estimate possible reactions to future events.

Stock investors can also track short-term stock movements. Fundamental investors opt to focus on trading over the long haul, but the odds are that they still want to find favorable buy-in price and favorable selling prices when liquidating a position. Stock technical analysis software is the key to doing this. Stock technical analysis tools such as the moving average can assist the trader in doing this. Moving averages are used by chartists and some fundamental investors to determine longer term break out patterns. They see this as a way to solidify a favorable entry or exit price for a particular stock.

There are many other technical analysis tools that are available to investors including Fibonacci indicators, stochastics, as well as trend trading. Many investors either practice one type of analysis or the other, however there are those investors who believe that that both fundamental and technical analysis can and should be combined at times.


Market Direction

Where are the big profits being made in this market? In the stocks that are breaking out! Breakouts are usually the result of extended positive bullish sentiment. That is exactly what has been developing over the past three weeks. Ever since the appearance of a bullish cradle pattern in both the Dow and the NASDAQ, the expected result of that pattern has been exhibited, a very strong bullish move.

An extended bullish move facilitates individual stock prices to move to the point where investor enthusiasm builds up greatly. How do you find stocks that have the potential of breaking out? The candlestick patterns! The Fry pan bottom, the Scoop pattern, and the Cradle pattern have produced inordinate profits over the past three weeks. They easily provide the visual format for identifying which stocks are at the point of breaking out. All boats will rise in a rising tide. The benefit of candlestick analysis provides investors is the identification of chart patterns that result in very large profits.

Technical Analysis Software, DOW

DOW

As the market continues its upward trend, currently showing the signs of some toppiness, but not yet showing any evidence of the sellers taking control, investor confidence is producing more and more big price moves. Last week, our VCI recommendation had over a 45% move in one day, producing approximately a 60% return in one week. The same results are occurring in a good number of recommendations.

Technical Analysis Software, SQNM

SQNM

Technical Analysis Software, STCK

TCK

One of the comments from the chat room today hit the nail on the head about candlesticks signals. Although the market was traded relatively flat, their portfolio was up 2 1/2% to 3% for the day. This is one of the inherent benefits of using candlestick analysis. Simple portfolio management techniques will have a portfolio that was established from signals or patterns that produce high probabilities of profitable trades. The strength in those signals or patterns will usually carries through on flat or even bearish trading days. This is the result of establishing positions based upon stronger than normal buying indications entering each individual stock price.

Candlestick signals produce powerful implications. Use that information to your advantage. Whether daytrading, swing trading, or long-term investing, the information built into candlestick signals provide a high probability trading program that continually puts the probabilities of being in the right positions at the right time.

FUPAW – The Profit Scanner Training session scheduled for today, Monday, July 27, was not scheduled appropriately. It has now been rescheduled for tomorrow afternoon, Tuesday, July 28, 4:15 p.m. ET. Click here for instructions.

Chat session tonight for members at 8 p.m. ET.

Due to travel conflict, Thursday night chat session, July 30, will not be scheduled.

Next Monday and Thursday’s sessions will be scheduled if Internet connections can be made.

Good investing,

The Candlestick Forum Team


This Week’s Special

Projecting Price Targets with Bonus Ebook;
Big Profits Using Candlestick Signals and Gaps
Website special reflects current newsletter. If you are reading an archived newsletter you will be directed to Current Website Special.

Stock Trading Programs

Telechart Trading Program
Hello Investors,

Are you the type of person that wants to have all your questions answered immediately when trying to learn a new investment program? Wouldn’t you like to get instant explanations and recommendations when viewing a Candlestick chart or pattern, directly from Candlestick experts? Join TeleChart 2005 Platinum through the Candlestick Forum and chat with Steve Bigalow LIVE!  Join Steve and fellow candlestick traders in the “Candlestick Forum” club on TeleChart 2005 Platinum. The Candlestick Forum, in association with TeleChart 2005, now provides the most direct, fast path method for becoming an expert in Candlestick investing.

Purchase of TeleChart 2005 is separate from the Candlestick Forum paid membership service. You will find Stephen Bigalow in the Candlestick Forum  club  hosted through TeleChart 2005 and listed in their Club Directory. This club is open to all TeleChart2005 users.

TeleChart 2005 Platinum users look for the Candlestick Forum in the Club Directory.  Join Steve and other members in the “Candlestick Forum” club on TeleChart 2005 Platinum.

Club Name:        Candlestick Forum

Every effective investor needs the right tools to make good market decisions. Cutting edge information, great price charts, sound investment advice…these are all critical components in developing a solid, money-making investment strategy. Now all these tools and much more have been brought together in one place!

The Candlestick Forum and TeleChart 2005 …The Ultimate Stock Market Information Network!

Combining cutting-edge information sharing and news with the quality charting and data service you’ve come to expect, TeleChart 2005 Platinum is really is your solution to market research. Plus—you can get my commentary and reports on key stocks without ever leaving the charting program!

Check out these amazing features in TeleChart 2005 Platinum:

· Streaming data

Ø TeleChart 2005 Platinum service automatically includes streaming, real-time data and intraday charts. Because of TeleChart 2005 Platinum’s unique replicated servers and exclusive new AccuTick™ technology, you enjoy some of the most reliable and accurate Real Time data available. Plus—you can choose from a developing list of Real Time sort criteria applicable to the streaming data on intraday charts updated every 60 seconds…and we even pay your exchange fees!

· Real time alerts

Ø TeleChart 2005 Platinum also allows you to send real time alerts to your e-mail or pager. You can be alerted of price changes or important developments for any number of stocks in the system.

Ø In TeleChart 2005 Platinum, you are automatically part of an investor group keenly interested in learning more about the Stock Market and in benefiting from the commentary from top analysts in today’s market. And, you will now have access to my notes and reports on stocks, broader market issues and trends and Japanese Candlestick chart interpretation.

Ø Plus: You can now chat live with the entire TeleChart 2005 Platinum customer base about any ticker symbol in the system! I’ll be leading guided chat events where we can discuss individual stocks or industries…and remember, it’s all without ever leaving your charts! Learning about Candlesticks is now even easier by having this direct access to the experts. Just imagine… having one of the world’s leading experts looking over your shoulder and acting as your mentor!

· Shared Notes

Ø You can also publish your own notes to the TeleChart 2005 Platinum community. And, since your charts automatically attach to notes you get quick access and easy organization for this wealth of information.

· Live, continuous news feeds

Ø You have immediate access to TeleChart 2005 Platinum’s high quality news and information service built right into the program! You can read the hottest news stories about any stock continuously throughout the day and in real time! Plus—you get the latest earnings reports and announcements every day.

These great informational tools are built into the #1 charting service available. And all of this is automatically yours in your Candlestick Forum / TeleChart 2005 Platinum service. The most exciting thing for me—I can provide TeleChart 2005 Platinum for you at only $99.99 per month!

To sign up, simply click  to go to the Worden Brothers Website to review enrollment options. TeleChart 2005 Platinum will get you signed up to the system and get you started. You’ll soon be finding out why I know The Candlestick Forum and TeleChart 2005 Platinum will soon become your definitive market research solution!

Candlestick Analysis Technician – Houston Seminar – April 2007

We started off the weekend with a special ‘Hit & Run Candlesticks’ training session by Rick Saddler, aka Ricky Wayne, our Trading Room Moderator. We learned to ‘Keep it Simple – Keep it Mechanical’ with his easy to learn Mechanical Trading Techniques. His profit taking philosophy, ‘T-Line Technique’ and ‘Holy Grail’ setups gave us an eye-opening education. The session reviews were so compelling it prompted a business meeting between Stephen Bigalow and Rick. Look for a new addition to our website soon with more from Rick Saddler in our new ‘Hit & Run Candlesticks’ Traders Corner. 
 
Hit & Run Training Session

Hardy Frank, James Farrell, AJ Vasaris, Pat Johnson, Kathy Card, Rick Saddler, Barbara Wollen, Agnes Bradt, Ed Cole, Ben Bass

2007 Seminar 2     2007 Seminar 3 

Next on the Agenda – Friday evening Cocktail Reception

A good time was had by all – ‘What happens at the seminar – Stays at the Seminar’

2007 Seminar 3 2007 Seminar 5
2007 Seminar Jim Cooper 2007 Seminar 7  
2007 Seminar 8  2007 Seminar 9
2007 Seminar 10 2007 Seminar 11
 
Fun and Games are over – Back to work – Saturday morning Registration and kick-off for 2 full days of intensive training.

2007 Seminar 12 2007 Seminar Stephen Bigalow Signing Book
PAT JOHNSON & ERIC JOHNSON