Commodities, feared by the majority of investors. Feared because commodities are highly leveraged and can wipe accounts out. At least, that is the general opinion of commodities. True commodity trading appreciates commodities more than stock trading. Commodity trading has much less outside influences for moving price than stocks. Commodities are not influenced by interest rates, accounting mistakes, poor management decisions, political rhetoric, etc. Commodities are mainly influenced by supply and demand, and maybe a few other outside influences such as weather conditions. This makes candlestick charting much more accurate when trading commodities.
Remember, Japanese Candlestick analysis was developed while trading a commodity, RICE. The Honshu family not only became wealthy from rice trading, they became legendary wealthy. Not with sophisticated computer programs, just basic eyewitness analysis and results. Results that were measured by actual profits. Money on the line profits.
Commodity trading is too risky to attempt without some sort of trading program. Shooting from the hip will not make you money in the commodities market. That makes candlestick charting a gold mine when trading commodities. The same depiction of fear and greed seen in stock trading is easily seen in commodity charts. It becomes apparent when viewing commodity charts that commodities have much smoother trends. Note in the Cocoa chart, that once the trend started up, it did not waffle from its ascent.
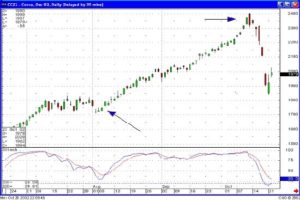
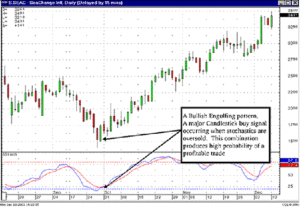
Commodity Trading Chart
As seen in the December Cocoa chart, after it was recommended due to a gap up in price, the trend stayed very consistent over the next month and a half. No great swings caused by outside influences. This steady price move is much more evident in commodities versus stock prices. Also, when a clear sell signal appeared, the Bearish Engulfing pattern, the new trend produced a fast and consistent move.
Candlestick charting has become very valuable due to the consistency of the commodity price moves. What was once considered highly speculative investments has become credible income generators. When the trends can be clearly identified, the risk is dramatically reduced. The candlestick signals applied to commodities still illustrate the same investment psychology as seen in any other investment vehicle.
The adage in commodity trading is that if you can hit a 55% correct trade ratio, you will make a fortune. Commodities move with the same oscillations as witnessed in most trading entities. Moving from oversold to overbought ranges produces high probability trades. Trading commodities allows the investor to have a market to extract profits when other trading markets, such as the stock market, are not providing a good investing environment.
Commodities usually trade independently of other commodities. Unlike the stock market, this eliminates the prospect of a related company’s “bad news” affecting a position you own. This is not to say that some commodities don’t trade in tandem, such as soybeans and wheat or live cattle and feeder cattle. But this is not an extensive list to be concerned about.
The Candlestick Trading Forum utilizes candlestick charting for low risk, high probability trading programs. There is a good number of commodities to trade, each unrelated to the others. This creates the opportunity to find a clear cut, undeniably excellent buy or sell signal using candlestick charting most any time. No matter what the economic atmosphere prevails, there should be an excellent trade setup somewhere. The Candlestick Trading Forum will not always have a recommendation every day. But when all the parameters are aligned, making for that “perfect trade”, we will put out that recommendation.
Special presentation video by Stephen Bigalow on Introduction to Trading Commodities(free video recorded at recent live webinar)
