The Hammer Signal – Analyzing Its Influence On Market Direction

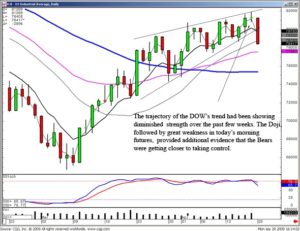
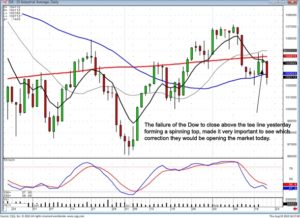
Market Direction – For the as two weeks, the NASDAQ has produced many indecision type days. Doji’s, and inverted hammers, hammers, all occurring when the stochastics have been in the oversold conditions. This would usually indicate that a major trend reversal is about to occur. However, this period of indecision has been in a slow downwards direction. The stochastics for the NASDAQ was just coming up out of the oversold area but now looks like they could be moving it backed down. The Dow has been showing some indecision days right on the 200 day moving average with the stochastics coming up all the oversold area. Friday formed another doji day.

The Doji in the Dow on Friday at lease provides a trading platform for Monday morning. A general rule of thumb is that the trend will move in the direction of how it opens on the day after a doji. The indications favor that some buying should be moving the trend upwards. However, these indications have been present for the last four to five days. If nothing positive happens on Monday or Tuesday, that would be an indication that the buyers are still not in this market and this may just be a consolidation before the next move down.

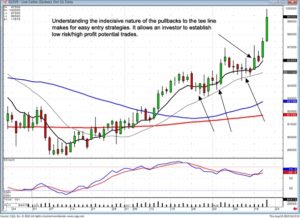
As you may have seen in the morning comments, it has been advised to be heavier in cash recently. The reason for this is that the signals are indicating that we are in a bottoming condition in the markets but there has not been any buying confirmation as of yet. It has been advised to buy lightly in this area but to be very nimble, be ready to close out positions as they get weak. This is contrary to the usual Candlestick investing philosophy. With 9900 trading entities out on the market, the candlestick signals can find enough good buy signals and sell signals to always have the portfolio completely invested. However, as we have witnessed in the NASDAQ, especially the last two weeks, each day is illustrating very indecisive investment sentiment. Up one day with the doji, down the next day with a doji, up one day with a hammer, down the next day with an inverted hammer. The candlestick signals are a very powerful investment platform for putting the probabilities of being in a correct trade in your favor. There are times in the market when those probabilities cannot be easily identified. The point of investing is to make money by exploiting the advantages of whatever trading program you’re using. When the market gets in a condition that those advantages cannot be put to good use, why have your money exposed? It is better to sit back in cash until the advantages can be utilized. This produces some mental rest and gets the mind clear for identifying the next move in the markets.

Market Example of Candlestick Hammers

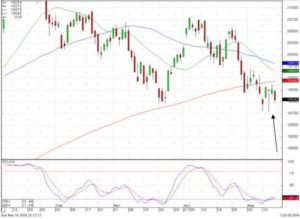
Example of Hammers in the Market

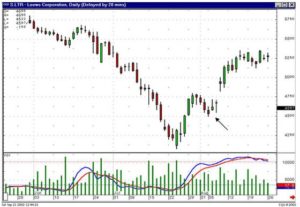
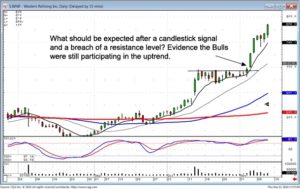
The one major signal that was produced this past week was the huge hammer that formed in both the NASDAQ and the Dow on Wednesday. The hammer represents selling at the bottom and finally the buyers stepping in. The long shadow to the down side is the obvious feature. It usually represents the very bottom of the downtrend. Unfortunately, the trading can continue to languish in the area of the shadow for a while. This could mean another few weeks of a sloppy sideways market if a signal does not appear showing which way the market will go. This all may seem very nebulous as far as projecting what the market should do, but there are times when the signals tell us that the market doesn’t know what it wants to do. This may be one of those times.
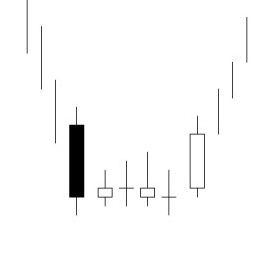

Candlestick Signal Hammers

HAMMERS
(karakasa)

Description 

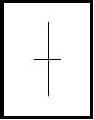
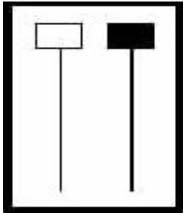
The Hammer is comprised of one candle. It is easily identified by the presence of a small body with a shadow at least two times greater than the body. Found at the bottom of a downtrend, this shows evidence that the bulls started to step in. The color of the small body is not important but a white candle has slightly more bullish implications than the black body. A positive day is required the following day to confirm this signal.

Criteria

  1. The lower shadow should be at least two times the length of the body.
  2. The real body is at the upper end of the trading range. The color of the body is not important although a white body should have slightly more bullish implications.
  3. There should be no upper shadow or a very small upper shadow.
  4. The following day needs to confirm the Hammer signal with a strong bullish
    day.

Signal Enhancements

  1. The longer the lower shadow, the higher the potential of a reversal occurring.
  2. A gap down from the previous day’s close sets up for a stronger reversal move provided the day after the Hammer signal opens higher.
  3. Large volume on the Hammer day increases the chances that a blow off day has occurred.

Pattern Psychology

After a downtrend has been in effect, the atmosphere is very bearish. The price opens and starts to trade lower. The bears are still in control. The bulls then step in. They start bringing the price back up towards the top of the trading range. This creates a small body with a large lower shadow. This represents that the bears could not maintain control. The long lower shadow now has the bears questioning whether the decline is still intact. A higher open the next day would confirm that the bulls had taken control.

A Stock Trading System – Candlesticks and High Profit Patterns

Utilizing a stock trading system provides an investor with many benefits. The most important benefit is utilizing proven trading techniques. Most investors do not have a stock trading system. They tend to buy what is most advocated by investment publications and the experts on the financial news stations. The problem with that investment style is that when most industries and stocks are already highly publicized, most of the price move is already gone.

A true stock trading system is one that finds price moves before everybody is aware of them. Candlestick signals are a highly productive means for finding price patterns that work effectively. When one coordinates Candlestick signals with known high profit patterns, an investor can develop a stock trading system that constantly puts the probability in their favor. Making a study of the Candlestick signals, especially the 12 major signals, in conjunction with recognizing some simple high profit patterns allows an investor to consistently place investment funds in trades that will produce profits an inordinate percentage of the time.

When developing a stock trading system, one of the objects should be to keep it very simple to apply. The J Hook Pattern provides the Candlestick investor with some very simple profitable applications. The first uptrend will usually show clear Candlestick sell signals when it comes to an end. The top may be formed with the stochastics in the overbought area or very close to the overbought area. Because of the strong initial uptrend, the first evidence of sell signals should be acknowledged. Even if it is suspected that the uptrend could be forming a J Hook Pattern, why a risk remaining in the trade? When sell signals become evident, take profits.

What criteria makes a Candlestick investor suspect a J Hook Pattern to form? The analysis of the market trends in general might provide that information. For example, if a stock price has had a strong run up while the market indexes have had a steady uptrend, and the market indexes do not appear to be ready for a significant pullback, continuing its uptrend, then a strong stock move could warrant some profit-taking before the next move up in its trend. The benefit of being able to identify Candlestick signals is being prepared for the witnessing of some Candlestick buy signals after a few days of pullback. These signals would also alter the trajectory of the stochastics that should also be pulling back.

Witnessing Doji’s, Hammers, Inverted Hammers, or Bullish Haramis after a few days a pullback becomes an alert that the sellers are starting to wane. If the stochastics are flattening out during that same time frame, then a set-up for a J Hook Pattern is taking place. Taking profits when the first sell signals occurred in the initial uptrend eliminate the downside risk. Those Candlestick sell signals indicate that it is time they get out of the trade. Even though the strength of the initial move would cause us to suspect that a J Hook Pattern may form, there is no guarantee that the pullback couldn’t retrace 20%, 40%, 60%, or even greater, of the initial up-move.

This creates a trading strategy that allows for an investor to utilize the common sense built into the Candlestick signals. When it is time to get out, get out. If, after a few days, small Candlestick buy signals start forming, there is nothing wrong with buying back into the position. The second entry of this trade now has some targets that can be clearly defined. The first target should be the test of the recent high. Although this may not be a huge percentage return to that level, at least the probabilities indicate that it should be profitable.

The benefit of Candlestick signals, once again, can be applied if and when that recent high is tested. Witnessing another sell signal as the price approaches the recent high trading level would be a clear indication that the recent high was going to act as resistance. This would induce taking quick profits and getting back out of the trade. On the other hand, if strong signals are seen as the recent high is breached, that would be a clear indication that the recent high was not going to act as a resistance level and that the new leg of the trend is in progress. Recognizing this pattern and the elements that form it allows an investor to move decisively at the right points of a trend. Being prepared for the pattern and knowing what signals to look for creates opportunities to participate in a profitable trend while greatly reducing risk.

LTR Stock Trading System

LTR

Note the J Hook Pattern in LTR. Once the trend started up, the pattern formed when the price pulled back for a few days. However, the stochastics never reached the oversold area and they came down only part way before hooking back up. The signals indicated buying before it pulled back too much, showing the buyers were going to test the high of the previous week. The gap above the recent high indicated that the buyers were very eager to see prices go to much higher prices.

The Candlestick signals should be the basis for a successful stock trading system. The signals consist of hundreds of years of actual analysis, not simulated back-testing. Investment patterns have also been identified through the years. When the Candlestick signals are applied correctly to the high-profit potential patterns, their effectiveness becomes all that much greater. For the investor that wants to create a stock trading system that can be monitored for a success/failure ratio, he should input as much proven trading techniques into his program as he can accumulate. The strongest element for starting any stock trading system should be the Candlestick signals.

Basic Stock Information – Going Back To The Basics

The first step to understanding the stock market is to understand basic stock information. By knowing what a share of stock is, it is easier to understand the workings of the entire stock market. Before you begin investing in the stock market, it’s time to get your basic stock information.

Among the stock market basics, the share is the smallest unit of ownership in a company. The size of a share varies from company to company. It can even vary within one company as it issues more shares or buys back shares that were previously issued. If you own a share of stock in a company, you are a part-owner of that company. The sum total of all your stock holdings is called your stock portfolio. If a company issues dividends, or profits, to the shareholders, you will likely receive money based on the number of shares you own. Each year, companies issues corporate results and basic stock information for their shareholders to review.

One of the stock investing basics of stock ownership is the concept of limited liability. If Ford loses a lawsuit and must pay a huge judgment, the worse that can happen is your stock becomes worthless. This is basic stock information, but important to know; creditors can’t come after your personal assets. Whether as the result of a lawsuit or creditors, the worst losses you will experience investing in companies are losses on struggling stocks.

In the terms of basic stock information, the two types of stocks are:

  • Common stock – This is the type of stock held by most individuals. Those holding common stock have voting rights as well as the right to receive dividends. Whenever you hear that a stock is going up or down, the reference is being made to common stock. While not all publicly traded companies have preferred stocks, all publicly traded companies have common stocks.
  • Preferred stock – In spite its name, preferred stock has fewer rights than common stock, except with regards to dividends. Companies that issue preferred stocks usually pay consistent dividends and preferred stock has first call on dividends over common stock. Investors buy preferred stock for its current income from dividends, so look for companies that make big profits to use preferred stock to return some of those profits via dividends.

Liquidity

Another piece of basic stock information is that common stocks can easily be bought or sold, or they are highly liquid. Not all companies are traded daily but most of the larger companies appear daily on the stock market, giving investors the opportunity to buy or sell shares.

Conclusion

Learning how to invest in stocks is really a product of learning basic stock information and learning to understand to dynamics of a fascinating market. After learning basic stock information, forming a stock trading plan, and understanding technical analysis, a trader can begin to enjoy the hectic world of the stock market.


Market Direction

There are some very simple rules in candlestick analysis. Most recently, we have been discussing that an up trend is shown to have reversed after a candlestick sell signal AND a close below the tee line. The opposite is true after a downtrend, a candlestick buy signal followed by a close above the T-line. This scenario occurred around March 10.

A close below the tee line after an extended uptrend clearly reveals a change in trend direction. This set of rules is very good for the longer holding swing trader. Simple commonsense assessments allows an investor to move more quickly. Today’s trading in the Dow is a very clear example of why a candlestick signal being confirmed is the first criteria for a sell decision.

Friday, both the Dow and the NASDAQ formed a Doji in a relatively indecisive trading day, options expiration day. As far as investor sentiment, there was nothing to indicate any change in the bullish trend sentiment. However, there was a Doji formed on Friday. This would not have any major significance other than what had previously been occurring in the downtrend. There had been previous Doji’s followed by selling, usually bringing the trend back down to the T-line. Although the trend continued to stay above the tee line, the magnitude of the trend was diminishing, meaning it looked like the Bulls were running out of steam. Visually being able to recognize that an uptrend is running out of steam makes an investor more prepared. A Doji at the top, followed by strong selling, might have more credence for forming a reversal.

Basic Stock Information Dow April 20

DOW

Logic dictates that if the market appears to be losing strength and another candlestick sell signal has formed, the confirmation of that sell signal may have greater significance. The markets are in overbought conditions. Where is the first potential support level on a pullback? Once again, it could be the T-line. Taking profits on today’s open could have been a non-important activity had the markets supported at the T-line. In most cases, upon seeing the strength showing up at the T-line, many positions could have been repurchased. On the other hand, had the T-line not acted as support, as we witnessed today, the indicators showed the probabilities of closing some trades being greatly in favor of the investor. The market will tell us what the market is going to do. Evaluating that information correctly is very important for maintaining high profits.

A candlestick reversal signal, confirmed, is the first criteria for identifying a change of investor sentiment. The longer a trend persists, the more compelling the reversal signal needs to be. This makes the tee line in extremely important factor. It can be used in the anticipation of a reversal occurring as well as confirming that a reversal has occurred. Note in the FAZ chart, there have been numerous potential reversal signals during the downtrend. However, there should be one  observation that indicates the downtrend was still in progress. There was not a breach of the T-line.

Basic Stock Information FAZ

FAZ

FAZ closed right on the T-line today. How do we use this to our advantage? Very simple, if we know what the tee line has represented in the past, we know what should or should not occur in the future. Today’s trading produced a gap up bullish candle after a Doji signal on Friday. This produced a confirmed buy signal. The only missing requirement was that it did not close above the T-line. Tomorrow’s trading strategy becomes very simple. If the price opens lower and does not show any strength, what can be assumed? The tee line continues to act as resistance. On the other hand, if the price opens above the tee line, a whole new set of assumptions occur. The tee line, which had acted as resistance, was now not acting as resistance after a strong buy signal in the oversold conditions. This would allow an investor to establish a position immediately without any hesitation.

Candlestick analysis is many simple if/then situations. The results are relatively predictable based upon hundreds of years of observations. Because investor sentiment works in constant reoccurring patterns, having the ability to recognize when the signal/patterns have occurred or might be in the process of occurring allows for a much faster execution decision-making process. You will gain bigger profits by recognizing when to move and when to move quickly. Please learn the 12 major signals and the Candlestick Forum patterns. The more knowledge you have about when a price move is about to occur, the better the buy and sell decisions can be made.

Good investing,

The Candlestick Forum Team

Stock Market Analysis

There are two main types of stock market analysis utilized by investors. They include other concepts, some of which will be explained in this article. When performing analysis on the stock market, there are many factors to consider, but first you must decide which method you would like to utilize.  Stock market analysis includes fundamental and technical analysis. Investors will typically stick to one method or the other and will typically not use both in tandem. 

Stock Market Analysis includes the concept of fundamental analysis. Fundamental analysis is the long-term assessment of a company’s financials in order to calculate how much the business is worth. This tells investors how much the company’s stock is worth to determine the potential shares the investor is willing to buy for that company. Investors who utilize this method also practice other concepts. These concepts include knowing the price to earnings ratio of a company, meaning that investors need to know what the company’s share price is compared to its earnings per share. Investors also need to know the dividend yield which is the company’s annual dividend payments and also need to know what the dividend per share divided by the price per share is for that company. There are other concepts included in this type of stock market analysis, but the main idea of fundamental analysis is bases on long-term investing.

Another form of Stock Market Analysis includes technical analysis. This type of analysis includes the forecasting of future financial price movements based on past price movements. This method can assist investors to anticipate what is likely to happen to prices over time. Technical analysts are not interested in the intrinsic value of a company but prefer to identify patterns that suggest future activity.  These investors use technical analysis tools, including the use of stock charts. The use of charts in this type of stock market analysis enables the investor to identify the underlying trends or stock chart patterns for that stock. They look for stock charts with rising trends and the familiarity with trend line formations can help to measure the overall attitude of investors towards stock and companies.

When performing technical stock market analysis the investor will take part and learn about stock charting.  When learning how to read stock charts the beginner investor should learn now to read four types of charts. Those include bar charts, line charts, point and figure charts, and candlestick charts. Many successful traders believe that candlestick chart patterns are the easiest and most beneficial to read. Unlike bar charts that illustrates what price movements did during a specific time frame, candlestick charts reveal ‘how’ that price moved. Candlestick charts demonstrate what investor sentiment was doing during the time frame and how it did it. This additional information creates a huge advantage for the candlestick investor when participating in stock market analysis.

When deciding which type of stock market analysis is right for you, please note that there are two arguments against stock fundamental analysis. The first is that a lot of the fundamental type of information is very subjective since it is based on each individual investor’s interpretation. The second reason is that stock technical analysis investors believe that fundamental analysis provides no real advantage. They believe this is due to the fact that all of the investing information is based on information that investors in publicly traded markets already know.

If you have decided to participate in stock market analysis, be sure you understand the advantages and disadvantages of both types. This will help you to make a decision as to which method you would like to practice.

Stock Price Pattern Analysis

All traders and investors want to buy stock at the lowest possible price and sell stock at the highest stock price. Just how do we do this? Fundamental analysis tells us what stocks are capable of but does not tell us just how high or low stock prices will go or just when they will peak or bottom out. Whether one is trading stocks directly or trading derivatives as in options trading or futures trading, timing is of utmost important in gaining trading profits.

Stock price pattern analysis tells the trader what the market is about to do. Using technical analysis tools such as Candlestick pattern formations traders can, in the words of Candlestick traders, let the market tell them what the market will do. Stock price pattern analysis works because stock price patterns repeat themselves, especially in large and fluid markets. Although everyone can do the fundamental analysis on a stock not all will trade that information the same. In addition, traders react to market movement and commonly drive a stock price higher or lower than the stock fundamentals dictate. It is from the ebb and flow of stock prices that stock price pattern analysis leads to profits.

Stock price pattern analysis is the basis of the technical analysis of stocks. Stock price pattern analysis comes down to comparing known patterns with what is evolving on the chart in Candlestick chart analysis. In a sense price patterns have a front half and a back half. Since, in our universe, time only moves in one direction, the front half predicts the back half in stock price pattern analysis. For example, when the stock market is coming to a consensus on a stock price the price pattern will often look like a wave form that is shrinking as it moves along. If one charts the movement of stock prices and draws a line from peak to peak and trough to trough it will look like two converging lines. If we imagine that the base of these converging lines is connected we have the makings of a triangle. When the upper side of this triangle is horizontal and the lower portion ascending this pattern often is indicative of a market coming to a consensus before an upward breakout in the stock price, a one stock market rally. This is an ascending triangle pattern. When the upper side is descending and the lower is level it is typically a bearish indicator and the stock will often break out to the downside.

There are many signals that are of use in stock price pattern analysis. A primary and very useful feature of Candlestick patterns is that the system is very visual. It contains all of the information of the markets but is typically easy to read and understand. Both the savvy day trader and those interested in long term investing can use stock price pattern analysis to buy stocks and sell stocks at the most advantageous and profitable prices. An old expression about learning about stocks was learning how to play the stock market. This expression dates back at least to the 1920fs before historyfs worst stock market crash. What traders and investors learned in the aftermath of that economic disaster is that a more disciplined approach to investing and trading can be profitable and is in no way the sort of gambling implied in this old expression. Using both fundamental and technical analysis pays dividends. Using a tool such as Candlestick chart analysis effectively helps predict the future by current stock price patterns to historic stock price movement.


Market Direction

There is a universal thread throughout candlestick analysis. Each aspect of investing, using candlestick analysis. utilizes one basic premise. It is purely common sense and it consistently puts the probabilities in the candlestick investors favor. The description of investor sentiment involved which created a candlestick signal or pattern is easy to understand. Each signal merely reveals what was occurring in investor sentiment. This knowledge allows investors to make rational decisions. Is it time to buy? Is it time to sell? Is it time to continue to hold? The signals and patterns utilized in conjunction with other confirming indicators produces high probability results.

These same favorable results can be applied to each aspect of investing. Knowing what each signal has conveyed, and knowing where it occurred in regards to  confirming indicators, the analysis to enter or exit a trade also becomes easy to execute. Common sense questions and answers allows an investor to make decisions that dramatically improve the probabilities of when to enter a trade or not. There should be a logical result if there is logic built into candlestick buy signals. That logic may be as simple as what should be expected after seeing a candlestick buy signal? The answer should be simple. There is evidence the buyers are still participating. As can be seen WRC chart. It had a set up for a bullish trade. If this trade was going to be executed after the large Bullish Engulfing Signal, what should be witnessed? Evidence that the bulls were still in control. When the price opened at the lower end of the previous days body, that does not reveal the presence of bullish strength. This is where the trade would not have been executed.

Stock Price Pattern Analysis WRC

WRC 

Although this is not rocket science, many investors will disregard the common sense aspects of investing and put on the trade. What is usually their rationale? They were buying at a lower price than where they expected, anticipating this trade should move higher. What they do not account for is the fact that there was no evidence the Bulls were going to be taking the price higher. What is usually the basis for buying at a lower price? Ego! Everybody wants to buy as low as possible and sell as high as possible. Unfortunately, that methodology does not necessarily equate to buying at high probability times.

The WNR chart reveals a different evaluation. The price continued to push against a resistance level without retracing. For this to be a successful trade, what should be expected after the little buy signals in early November? Bullish confirmation! Because the ego wants to buy at the absolute bottom and sell at the absolute top, most investors consistently lose money. The candlestick investor has the advantage of buying when the chart/signal says to buy and sell when the chart/signals say it’s time to sell. When you take your ego out of the investment decision, the probabilities of being in the right trade at the right time improve exponentially.

Stock Price Pattern Analysis WNR

WNR

Chat session tonight at 8 PM ET. Everybody is welcome. Learn how to distinguish when it is time to buy and sell based upon the candlestick signals and the premarket futures.

Good Investing,

The Candlestick Forum Team

Learning How to Read Stock Charts Using Candlestick Signals – The Doji Signal

Learning how to read stock charts can be a very simple process. The major signals clearly illustrate trend reversals.  Most investors, when learning how to read stock charts, feel that they need a multitude of indicators on one chart.  Candlestick analysis does not require numerous indicators. When utilizing the major candlestick signals, chart analysis becomes very easy. The major signals reveal an immense amount of information. When learning how to read stock charts, the process should be as simple as possible.     

The Doji is one of the most revealing signals in Candlestick trading. It clearly indicates that the Bulls and the Bears are at an equilibrium, a state of indecision.  The Doji, appearing at the end of an extended trend, has significant implications. The trend may be ending.  Just this fact alone creates a multitude of investment programs that can produce inordinate profits. What is the best method for making big trading profits? Knowing how to read the stock charts!  Knowing the direction of a trading entity and the strength of that move! Candlestick analysis perfects that trading strategy. Candlestick charts reveal high probability profitable reversals.  Hundreds of years of investing refinement have proven that point.

The Japanese say that whenever a Doji appears, always take notice. A well-founded rule of Candlestick charts followers is that when a Doji appears at the top of a trend, in an overbought area, sell immediately. Conversely, a Doji seen at the bottom of an extended downtrend requires buying signals the next day to confirm the reversal. Otherwise, the weight of the market could take the trend lower. Knowing how to read the stock charts reveals the parameters that make a major signal most effective.

The Doji signal is comprised of one candle. It is formed when the open and the close occur at the same level or very close to the same level in a specific time frame.  In candlestick charting, this essentially creates a cross formation. As the following illustration demonstrates, the horizontal line represents the open and close occurring at the same level. The vertical line represents the total trading range during that time

Doji

DOJI STAR

Upon seeing a doji in an over-bought or oversold conditions, (over-bought  or oversold conditions can be defined using other indicators such as stochastics), becomes an extremely high probability reversal situation.  When a doji appears, it is demonstrating that there is indecision now occurring at an extreme portion of a trend. This indecision can be portrayed in a few variations of the doji.
 
Criteria

  • The open and close are the same or nearly the same
  • The length of the shadow should not be excessively long, especially when viewed at the end of a bullish trend.

Signal Enhancements

  • A gap away from the previous day’s close sets up for a stronger reversal move.
  • Large volume on the signal day increases the chances that a blowoff day has occurred, although it is not a necessity.
  • It is more effective after a long candle body, usually an exaggerated daily move compared to the normal daily trading range seen in the majority of the trend.

There are many variations of Doji. To read further, select The Dynamic Doji – A Clear Trend Reversal Signal  OR Return to Candlestick Explanation of the Major Signals

Training Tutorial – The Dynamic Doji     One of the most informative and revealing candlestick signals.

 Candlestick Forum Flash Cards   These unique Flash Cards will allow you to be “trading like the Pro’s” in no time.

Buying Puts – Bearish Options Trading Strategy

Buying puts is a bearish, somewhat speculative technique in which the investor anticipates that a stock will decrease in price during a set period of time. The trader realizes a profit when the stock and its underlying put option decrease in price during a set amount of time. The profit potential in such a deal is limited because a stock price can never go below zero. Also known by the term “buying in-the-money puts”, this technique is speculative; if the price of the stock remains steady or rises during the option period, it is possible for the trader to lose the initial investment. This risk reward ratios, however, are limited to the amount paid for the premium on the put option.

The technique of buying puts is dependent on timing and charting a stock’s movement to catch a downward price movement. Accurate charting of a stock and technical analysis of its performance and direction are critical when buying puts. There are a variety of events that can move the price of a stock down as desired, such as poor earnings reports, buyout or acquisition of the company, and new product introduction are among the events that can shape the views of investors and impact the stock market. This strategy of buying puts can also put more money in the pockets of successful traders.

The downside of this technique tends to be the possibility of an error of judgment. If an investor decides to buy puts on a stock without properly researching its position or charting its movement, it is possible that stock will be bullish or changing from bearish to bullish. In essence, if a stock reached its bottom or is rising, the trader has moved at the wrong time and is in danger of losing the premium for the trade. Investing mistakes such as this are a prime example of what can go wrong when buying puts.

Buying puts is actually an alternative to selling short on a stock. While being similar to buying calls, the advantage of buying puts over selling short lies in the ability to leverage the transaction and make your trading more successful. Since the puts can be purchased on the margin, it is possible to control a much larger number of shares, thereby increasing the profit potential on the purchase. Downward movements in stock prices and their underlying put options create much larger returns than by simply selling short.

The price of a premium for buying puts is affected by two variables. First, the time period involved for the option is a determining factor in price. The longer the time between purchase and expiration dates, the higher the price. Second, the movement of the underlying stock affects the price of the premium, especially in relation to the stock’s strike price. A stock that has been in a bearish trend will have a higher premium than a stock in a bullish trend. This is a stock market basic that can be successful even for a beginner investing in the stock market.

Buying puts is one of the stock option trading strategies that provides the investor with the opportunity to make money on a stock expected to be bullish. Remembering to follow a proven stock market trading system will help deter the trader from moving on the wrong stock.


Return to main Options Trading Category

Stock Market Investing 101 – Simplified Utilizing Candlestick Signals

Stock market investing 101 should include as easy a process to learn the stock market as possible. Candlestick signals incorporating common sense investment practices meet those criteria. Stock market investing 101 is a process that should allow investors to understand why prices move. The psychology incorporated into candlestick signals makes understanding what is going on in an investor’s mind very easy to analyze. The signals were created through hundreds of years of visual analysis and interpretation by successful Japanese Rice traders.

Most stock market investing 101 courses want to include fundamental reasons for why prices move. MBA’s graduate every year with the concept if you can read a strong balance sheet, the price will move. One of the biggest misconception of investing is anticipating prices to move based upon fundamental reasons. The first lesson of stock market investing 101 should be that prices move based upon the “perception” of fundamental reasons. The Japanese Rice traders discovered this many centuries ago. Why do prices go down when good news is announced? Because the anticipation of that good news was already built into the stock price.

Candlestick signals are formed based upon the investor sentiment that indicates a change. Use this information to your advantage. You may not have a research staff or access to extensive research, but you can take advantage of the information conveyed in candlestick signals. Why do candlestick buy signals occur at the bottom? Because the smart money is anticipating what the future potential is for the price. That future potential may be good news. The prospect of favorable news  is what makes the smart money buy when everybody else is selling. The announcement of the good news is what makes the smart money sell at the top when everybody else is buying. That information is conveyed through numerous candlestick signals.

Three Black Crows

Trading The Three Black  Crows Pattern

Description

The Three Black Crows got their name from the resemblance of three crows looking down from their perch from a tree. The signal, occurring after a strong uptrend, indicates the crows looking down, or lower prices to come. This pattern is the opposite of the Three White Soldiers.

Criteria

  1. Three long black bodies occur, all of close to or equal length.
  2. The prior trend was up.
  3. Each day opens within the body of the previous day.
  4. Each day closes near its low.

Pattern Psychology

A long black candle forms after an uptrend. This uptrend has now reached levels where the sellers have started to step in. The first long black candle body is followed by two more long black candles. Each having opened in the previous day’s body, indicating that buying was occurring early each day but the Bears kept forcing prices down by the end of the day. This consistent process of selling provides a stronger downtrend potential versus a rapid overselling period.

Training Tutorial

Candlestickforum Flash Cards  These unique Flash Cards will allow you to be “trading like the Pro’s” in no time.

Return to Candlestick Explanation for Secondary Signals

Basics of Commodity Trading

To trade commodities successfully traders ought to start by learning the basics of commodity trading. Trading commodities is really commodities futures trading. Producers and processors of commodities buy and sell futures contracts for delivery on a specific date during any of the next months or years. Producers and processors are typically hedging their investment risk and helping to provide a stable market for the commodity in question. Speculators can trade the same commodity futures contracts by buying and selling futures or they can buy options and sell options on futures contracts. Commodity and futures training is a good place to start learning the basics of commodity trading. For those interested options trading in commodities marketsOptions Training with Stephen Bigalow will provide basic knowledge as well as the deeper insight gained from experience trading options in commodity futures.

Commodity futures as an asset class differ from stocks or long term bonds. A standard futures contract for corn futures, oil futures, or gold futures is a claim or a promise relating to a standardized quantity of a tangible asset. The claim for delivery or promise to deliver is on the contract expiration date. As a matter of fact, traders seldom hold a contract through to expiration but rather execute the opposite trade on the same commodity and expiration date in order to exit the trade. Because a futures contract has an expiration date it is not a claim upon the assets of a corporation. Supply and demand often cause pronounced commodity price shifts. Agricultural commodities are especially prone to large fluctuations in price as variation in weather conditions and amounts of crops planted or cattle culled from herds affect supply. The basics of commodity trading are that a trader in commodities is not concerned with competence of management, a margin of safety, or diversifying a stock portfolio into various market sectors. He or she is concerned with drought in Argentina or Russia, the opening of markets in Asia, or, in the case of gold, the seemingly continual devaluation of the US dollar.

The basics of commodity trading are that some commodities can be stored, like gold, oil, and corn. Some commodities, such as milk, have a short shelf life. Knowing the basics of commodity trading for a given set of commodities is essential for trading them. Traders should know that the decisions of large producers and buyers of commodities typically drive the markets in various commodities. Therefore, not all fluctuation in commodity prices is based upon the fundamentals of production and demand. It is also based on anticipation of market factors by large buyers and sellers. Thus, successful commodities trading requires the ability to anticipate the actions of other traders, the commodities market. Using technical analysis tools such as Candlestick chart patterns helps the trader see where the market is going. This is because trading patterns in commodity prices tend to repeat themselves. Knowing the basic Candlestick analysis patterns helps the smart trader with useful knowledge to successfully trade and profit from trading commodities.


Market Direction

What is the most important indicator when analyzing candlesticks signals? There are numerous confirming indicators that improve the effectiveness of candlestick signals. Stochastics play an important role for adding credence to the candlestick signals. Major moving averages demonstrate good support or resistance potentials. The T-line demonstrates whether a trend is going to continue or possibly reverse. However, the most important aspect when using candlestick analysis is the signals themselves.

This was clearly demonstrated today in both the Dow and the NASDAQ. Yesterday both indexes closed just at the T-line. However, each had formed an indecisive Spinning Top formation. Both the Dow and the NASDAQ had stochastics showing oversold conditions. This would have suggested there was going to be more upside movement. The accuracy of trend analysis is greatly enhanced by knowing what each individual signal represents. Also, there are a few basic rules that can be applied to each signal.

Commodities Dow

DOW

Although the stochastics were in the oversold condition, starting to curl up, knowing what should occur after specific signals made today’s trading relatively simple. The trend/price is going to move in the direction of how prices open after a Doji/spinning top. When the premarket futures were slightly soggy and the markets immediately started selling off, this produced immediate information. The Bulls were not yet able to take the market up through the T-line. How was this information useful?

A weaker open after a Spinning Top, right at the T-line, would have made any buying of long positions today not be executed until prices showed bullish strength. The weak open provided the prospect that the tee line was still acting as resistance. The uptrend had to be confirmed with a candlestick buy signal, which both indexes demonstrated a few days ago, and a close above the T-line. The weaker open today should have delayed any long position buying and instigated closing any long positions that were showing weakness or also not able to break through the T-line.

This is not sophisticated trend analysis. The visual aspects of candlestick signals and the simple rules that are associated with them provide a common sense trading format. There are many if/then trading rules that illustrate what reoccurring investor sentiment is doing. Those thought processes are very consistent.
The effectiveness of reoccurring patterns provides huge profit potential in all trading entities. As illustrated in the October Live Cattle chart, the uptrend contained a number of pullbacks. Each time the price pulled back, it could be observed  the formations each day showed indecisive selling. This is a common indication the uptrend is just resting.

Commodities December Live Cattle

Dec Live Cattle

Obviously, knowing when  high probability buy setups occur, profits for the account can build up extremely fast. Having the ability to accurately analyze which direction the daily price chart will move allows for very profitable intraday trading. Knowing the daily bias is up, a trader can take advantage of the profit-taking during the day and buy back when the intraday buy signals occur. Once again, this is not sophisticated analysis. This is merely understanding the common sense information built into candlestick signals.

Chat session tonight at 8 PM ET — Everybody is welcome. Tonight we will discuss how to fine tune your trend analysis capabilities.

Good Investing,
The Candlestick Forum Team

Cradle Pattern

Cradle Pattern Illustration

Candlestick Cradle Pattern

Cradle Pattern

The Cradle Pattern is a variation of the series of Doji at the bottom. It is aptly named, in that it looks like a ‘cradle’. This makes the Cradle Pattern an easily identified reversal pattern. It begins with the same visual alert found in most candlestick bottoming signals; a large Bearish candle at the bottom of a downtrend. This illustrates the extensive selling at the bottom. The following day shows a candlestick signal such as a Doji, Spinning Top, Harami, Hammer, or Inverted Hammer, indicating that the selling had stopped. Now the candlestick investor should be watching for a Confirmation ‘Buy’ Candlestick Signal. Keep in mind, the small indecisive trading signals may occur for a number of days before the ‘buy’ signal appears.

The Cradle Pattern reveals investor sentiment. If the large dark candle is considered the headboard, the Bullish candle becomes the foot board. The Cradle Pattern formation is now hanging at the bottom, implying that the trend should move up from this level.


The Cradle Pattern was first introduced by Stephen Bigalow in his second book titled

High Profit Candlestick Patterns; Turning Investor Sentiment into High Profits

This Cradle Pattern is also part of our Flash Card Set 2 – High Profit Candlestick Patterns

The clear graphics makes learning these high profit patterns an easy process. Each pattern is fully explained on the backside of the card. The description of how and why the pattern is forming makes understanding the potential of the pattern easy to comprehend.  Having this valuable knowledge at your fingertips allows an investor to extract large profits from the markets.

HIGH PROFIT CANDLESTICK PATTERNS

Cradle Pattern
Dumpling Top
Fry Pan Bottom
Jay-Hook Pattern
Scoop Pattern
Trading Channels
Gap Down Hammer at the Bottom
Gap Up Inverted Hammer
Gap Down After a Doji at the Top
Gap Down Doji at the Bottom
Gap Down Bullish Engulfing
Gap Down Bearish Harami
Gap Down Shooting Star
Gap Down Hanging Man
Tweezers Bottom
Tweezers Top
Multiple Tails to the Downside
Series of Shadows at the Top
Series of Doji at the Top
Series of Doji at the Bottom
Doji End of Flat Trading Range Top
Doji End of Flat Trading Range Bottom
Combination Bullish Signals at the Bottom
Combination Sell Signals at the Top
Double Bullish Engulfing Pattern
Double Bearish Engulfing Pattern
Double Bottom
Double Top
Breakout Through Moving Averages
Moving Averages Act as Price Magnets
Moving Average as Support
Moving Average as Resistance

For the Candlestick Forum Original Flash Cards, with the Major Signals, please click here.