Equity Market

Equity market is another name for a stock market. The term equity also refers to the value of someone’s ownership of a business, property, or a shareholder’s partial ownership in a business. An equity is a stock or stock share not bearing fixed interest. In other words an equity’s value rises and falls with that of a company and its shares. It does not pay guaranteed interest as with a bond.

Use of the term equity market reminds us that a stock market investment is owning shares of a company’s assets. An equity market is a public market where stocks are listed, bought, and sold. An equity market, or stock market, has members who do the buying and selling. Everyone else pays a commission for this service in order to buy stock or sell stock. Now, in the computer age, exchanges such as the NASDAQ are virtual and all activity is in a computer system. This contrasts with the traditional “outcry” system of the New York Stock Exchange (NYSE) where orders flow through a real person, a floor broker.

Equity markets allow companies to raise money without borrowing. Rather than incurring debt the company sells ownership shares, giving away future profits and giving a vote in the affairs of the company for each share. Although a public stock company may not incur debt by issuing stock, it always runs the risk of a takeover. An outside party can purchase a sufficient number of stock shares to control the company’s board of directors, name its own management and take over the company.

Besides allowing a company to raise money, equity exchanges offer very liquid investments. Stocks are almost always easier to buy and sell and a clear market value than real estate, for example. There are equity exchanges throughout the world. The New York Stock Exchange and NASDAQ are the two large American exchanges. Canada has the Toronto Stock Exchange. European exchanges include the London Stock Exchange, the Paris Bourse, and the Deutsche Börse. Asia has the Hong Kong Stock Exchange, the Tokyo Stock Exchange, the Bombay Stock Exchange, and the Shanghai Stock Exchange. In Latin America there are the BM&FBovespa in Sao Paolo, Brazil and BMV, the Bolsa Mexicana de Valores. In the United States market indexes such as the S&P 500 help traders and investors follow the market sectors.

A problem with dealing in many equity markets outside of the United States is the lack of transparency. The United States Securities and Exchange Commission (SEC) oversees American stock markets, helping to insure that illegal insider trading, for example, does not enrich some at the expense of others. Although the SEC does not do a perfect job it provides an oversight that is sadly missing in many markets outside of the United States. Even basic stock information may be lacking on some foreign exchanges. Unless the investor has excellent inside information in some foreign exchanges, the best stock market investing strategy may well be to trade and invest at home.

Trading in the equity market requires learning the basics of stock market investing. As stock prices move up and down traders and investors buy stock and sell stock in search of a profit. A day trader will buy and sell within a day, typically holding no stock positions overnight. Long term investing engages in techniques like value stock investing in order to capture a stock at a low price and allow it to appreciate in value over many years.


Market Direction

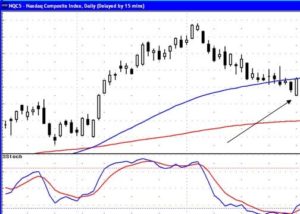
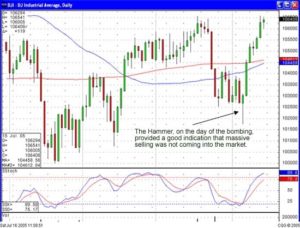
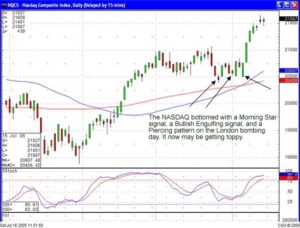
Did you know what the market needed to do this morning? Without candlestick signals, many people cannot answer that question. With candlestick signals, an investor can easily evaluate what is required to reverse or continue a trend. Yesterday’s trading produced a Doji in both the Dow and the NASDAQ. It was showing strength due to the fact that the previous day had been a very strong day. The early-morning selloff yesterday was the expected profit-taking. The Bulls needed to see a trading close near the top end of the trading range to indicate the uptrend was still in potentially progress. The other remaining factor was that neither the Dow nor the NASDAQ was able to close above the T. line. This created a potential warning.

Equity Market, Dow
Dow

Equity Market, Dow 5 minute chart
Dow 5 Minute Chart.

A candlestick signal, the Doji, allowed for a very easy assessment of what was required in today’s trading. If the Bulls were in control, the markets needed to open positive and trade positive. When that did not happen this morning, the next evaluation was to see whether the Bears were in control or whether this was another early-morning pullback. That becomes better evaluated by watching a five-minute and a 10 minute chart. After the initial 30 minutes of trading, it can usually be seen that the downside has found a churning area, a flat trading area where the Bulls and the Bears are in conflict. The analysis of a 10 minute chart visually fine-tunes an investors entry strategy. Once it could be seen the Bulls were coming back into the market, individual stock positions could be evaluated again to see if they were confirming their bullish signals.

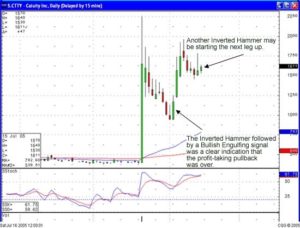
This is not a difficult analytical process. The chart patterns will be just the same on the daily chart as they will be for analyzing a five-minute chart. Having the ability to understand which signals and patterns work effectively at specific support and resistance levels allows for excellent stoploss procedures and excellent entry procedures. As illustrated in our recommendation today of TSTC, being able to assess that the Bulls were in control of this price even during the general market pull back, made for a very low risk trade execution.

Equity Market, TSTC
TSTC

The simple logic of analyzing a stock price holding its own or trading slightly positive when the rest of the market is being sold off allows for a profitable generalization.. If the Bulls show evidence they are returning in the general market, it can be easily assumed that the initial strength of this stock’s price was going to show more strength in a strong market.

The nice thing about candlestick analysis is that it is the evaluation of something that consistently does the same thing over and over, human emotions. Taking advantage of the reoccurring price movements makes for a simple process for consistently pulling profits out of the markets. Please take time to peruse the benefits found in candlestick signals. The weekend of February 20 and 21st, the Candlestick Forum will be presenting a two-day comprehensive training on candlestick analysis. This is not a training that promotes you will be able to pay for the training with the first trade you enter after the training is over. This is a training that does promote the idea that when you understand the nuances built into candlestick signals and patterns, you control how the trades are performed and you eliminate the emotions out of your trading program. You will discover about correlating the daily chart with a five-minute and 10 minute chart greatly enhance your entry and exit strategies. Click here for more information.

Chat session tonight at 8 PM ET.

Good investing,
The Candlestick Forum Team


This Week’s Special

J-Hook Quick Download

Click here for details

Website special reflects current newsletter. If you are reading an archived newsletter you will be directed to Current Website Special.

Options Markets – Deciding On Your Investment Options

When formulating a trading plan for options, it is important to think about what approach you want to take in the options markets before you trade. It is important to develop an investment philosophy that reflects the strategy you have for your trading.

Understanding Options Markets Trading

Understanding the options markets is a product of understanding options trading. Options are an agreement between two parties where one agrees to sell a stock to the other party within a specific time period and for a specific price. Ownership as commonly defined does not apply since you don’t need to own a stock in order to implement a position.

A stock order, whether it is a “call” (an agreement to purchase) or a “put” (an agreement to sell), gives the holder the right to trade options. The holder is able to simply let the options order expire without investing further or go ahead and purchase the stock as agreed.

Preparing To Enter The Options Market

With an understanding of options the next step before entering the options market is to solidify your trading rules or your trading plan. These rules should include:

    1. Verification – This is a critical part of the process. You wouldn’t want to drive a car that wasn’t inspected prior to you getting behind the wheel; the same principle is true with your trading plan.
    2. Strict Guidelines – Your trading plan must be specific and precise. Having a tested, reliable trading plan we give you something solid when you hit a losing period.
    3. Testing – you can successfully test your trading plan via paper trading on the Internet. Without testing, your trading plan is left to chance. Does it work or fail? Testing will give you the confidence you need to be a successful trader.

Basic Options Market Orders
The final step is to enter the options market and start trading. There are two basic kinds of options market orders, “Calls” and “Puts”. Calls are contracts made by a buyer offering the conditions under which he or she will buy a particular stock. Puts are contracts offered by sellers outlining the conditions under which he or she will sell a particular stock. Each contract consists of the following information:

  • Purchase Item – This is the stock
  • Strike Price – This is the price that is the target for the contract
  • Expiration Date – The day on which the investment timing is no longer binding
  • Quantity – Usually in groups of 100

These items are included whether the options market order is a Call or a Put. When buying a call, if the terms are not met, the contract is not binding. In addition, if the terms are met but the options market conditions have changed to make the deal unfavorable the buyer can simply let the contract expire and if desired, purchase the stock from the open options market.

Improving Your Odds In The Options Market

There is one more thing you can do to increase your odds of success in the options markets. By implementing a trading system like Japanese Candlesticks you will add a powerful charting system for your options markets investing. Candlesticks was invented over 300 years ago as a method for trading in the rice markets of ancient Japan. The system has become an amazing tool for today’s options markets. With the charting abilities you will gain from Japanese Candlesticks you can literally give you a clear view of the directions of options before they even move. Added to your trading plan, Candlesticks can help you to be a successful trader in the options markets.

Commodity Futures

The process of trading commodities is also known as futures trading. Unlike other types of investing such as stocks and bonds, when you trade futures you don’t actually buy anything.  Trading commodity futures includes the speculation of the future direction of the price of the commodity you are trading. To put it another way, you are actually betting that the future price will either go up or down, and how that will effect you depends on if you are the buyer or the seller of the commodity. The large companies that operate in these futures markets use futures contracts to lock in their selling prices for the product in advance of delivery of the product. The company that does this is actually doing what is referred to as “hedging.”  The other side of the transaction, when dealing with commodity futures, is the trader who speculates on whether the commodity price will go up or down before the contract is due for delivery. When trading commodity futures, no one has to take, or make a delivery of the underlying product that the futures contract represents.  Most of the time, the trader merely offsets his or her position at some time before the date that the contract is due.

The commodity futures market includes items such as wheat, corn, gold, silver, pork-bellies, heating oil, lumber, and many additional commodities. The main commodity trading groups actually include currencies, interest rates, stock indices, grains, meats, energies, metals, and food and fiber.  Currency trading is a great market for long-term trend followers since they exhibit long-term trends that reflect the health of the economy.  Interest rates also have great long-term trends with the best contracts being the T Bonds and T Notes.  Another category in the commodity futures market includes stock indices. Most commodity and futures traders use the S & P but they may also trade the DAX, the NASDAQ, and the Dow Jones. Energy is another group used when commodity investing, and it is the biggest physical commodity group in the world as it relates to volume. It also exhibits great, long-term trends all of the time. The main focus for speculators trading metals is on Copper, Gold and Silver. Additional metals that have produced great trends in recent years include platinum, and palladium.  Grains and meats have recently lost their luster and now speculators trade more financials, but the popular commodities in the group include pork-bellies, as mentioned above, live hogs, feeder cattle, and live cattle. The last group includes the food and fiber group. These commodity futures markets look at orange juice, cotton, coffee and cocoa, however cotton is probably the best market for long-term trend followers.

If you are interested in trading commodity, it is important to familiarize yourself with the COT report. The COT report stands for Commitments of Traders and the report is drawn by the Commodity Futures Trading Commission.  This report contains detailed information in the futures market on positions and volumes of contracts.  It is not meant for exclusive use of foreign exchange trading, but it instead lists out the conditions in the futures markets about contracts and whether the net contracts were long or short.

Many successful traders have become very rich in the commodity markets. When looking to invest in commodity futures investors know that it is one area where an individual who has limited capital can make great profits in a relatively short period of time. Patience and education is a must if you are interested in the commodity futures market.

Commodity Futures Price

Commodity futures price quotes are available for food and fiber, grain and oil seed, interest rates, cattle and hogs, metals, and oil and energy futures. No matter whether one is trading corn futures, oil futures, copper futures, gold futures, natural gas futures, or silver futures knowing the current commodity futures price is essential for profitable futures trading in commodities. One can find the current price on futures for any given commodity by looking online at the Chicago Mercantile Exchange, (CME), the Chicago Board of Trade (CBOT), the New York Mercantile Exchange (NYMEX), and the commodity exchange, COMEX. An excellent means of learning about commodity futures pricing and commodities markets is commodity and futures training.

Commodity futures contracts are agreements between two parties for the sale of a given quantity of a given commodity on a specified future date. Futures contracts can be for a few months or for years. For example, in May the COMEX trades corn futures contracts for delivery in May, July, September, and December of the same year. It also trades contracts for delivery in March, May, July, September, and December of each of the next two years. Then it trades contracts for July and December three years hence. Depending upon crop conditions, market demand, and factors such as the price of oil and the amount of corn being diverted to ethanol production the commodity futures price of corn will vary above or below the current spot price.

A commodities trading in futures should be distinguished from options trading in commodity futures. A futures contract confers the obligation to buy or sell the commodity in question if the contract is held until expiration. In fact, many traders will exit their position in the days prior to expiration. However, producers and buyers who are hedging commodities will, in fact, deliver or take delivery of the commodity in question. On the other hand buying calls and buying puts in the commodity futures market confers the option to buy or sell but not the obligation. Selling calls and selling puts, of course, confers the obligation if the buyer decides to exercise the option. The advantage of buying calls or puts is that the trader will only lose his premium if the commodity price does not move as expected.
As with all markets price movements can be predicted with technical analysis tools such as Candlestick charting and Candlestick pattern formations. Although fundamental commodity analysis will tell the trader the eventual commodity futures price he or she will need to follow the example of rice traders in ancient Japan in letting market history predict market future. Because history does, in fact, repeat itself in commodity market price patterns it is possible to predict that a market trend will continue or that market reversal will occur. The trader knowledgeable in Candlestick trading tactics will typically be one up on the rest of the market in profiting from commodity futures price movement. Letting the market tell the trader what the market will do is still an adage that works after hundreds of years of commodity trading.


Market Direction

The failure of the trend at the 50 day moving average makes the 200 day moving average the next likely target. Obviously, that should keep the orientation of your portfolio to the short side. After trading much lower during the day, the Dow and the NASDAQ attempted to close near the higher end of the trading range. This gave some possibilities of a small bounce tomorrow. The premarket futures will give a good indication of how this market is going to move tomorrow after today’s Doji’s. Keep in mind, one of the basic price patterns is the appearance of a Doji after a strong move one way or the other. The Doji indicates a day of indecision between the Bulls and the Bears. As seen in the Dow and the NASDAQ today, the Doji becomes a very good indication of whether a bounce could occur back up to the T-line or a lower open would indicate the bears have won, the downtrend will remain in progress.

Commodity Futures Price, DOW

DOW

Have you ever read the books that are titled “How I turned $5000 into $250,000 Trading Commodities”? What is the first reaction when looking at that title? Boy, I should be able to do that. I am reasonably intelligent. You take the book home and you read it from cover to cover hoping to learn that secret that made the author big bucks. However, when you have finished the book, you discovered the contents merely told how the author was long or short a commodity that was moving in a trend and they pyramided the position and made huge gains. The rest of the book merely talked about how the commodity market functioned. After reading the book, you sit there and say that was interesting but I did not learn how I was going to utilize my intelligence to make the big dollars like the author did.
Is it possible to make a fortune trading commodities? Yes, but not everybody is going to be lucky enough to be in a position that starts getting huge moves in one direction or the other. But big profits can be made trading commodities. If you are shooting for that big price move that you happen to be in at the right time, you will probably lose big bucks before you ever make big bucks. Fortunately, candlestick analysis allows an investor to make consistent profits while trading commodities. The bonus is that the signals and patterns put an investor’s funds in trade situations that has high probabilities of producing big price moves/big profits.

The biggest deterrent for most investors about trading commodities is they constantly hear about how risky they are. That is a completely true statement, provided you do not know how to trade commodities. Candlestick analysis creates a trading platform that makes trading commodities a non-risky venture. Candlestick signals are the graphic depiction of investor sentiment. That sentiment does not change whether you or trading slow moving bonds, stocks, or highly leveraged trading entities. Making big profits trading commodities is a combination of being able to identify the correct trades, then being able to control the emotional aspects of investing. The Japanese Rice traders made fortunes trading Rice successfully. The poignancy of that statement is that Rice is not a very exciting commodity. It doesn’t have great volatility in price.

How do you hit a lucky trade while trading commodities? As in the famous words of Thomas Edison, “The harder I work, the luckier I get.” Learn how to trade commodities correctly and you can make huge profits. Learn how to trade commodities correctly, and you’ll have a much better grasp on trading stocks profitably. This weekend’s Candlestick Forum Commodity Trading training concentrates on how to identify high profit trades, then how to maintain your mental discipline to maximize the profits of each trade. Can you turn $5000 into $250,000? It is feasible but not likely. Can you turn $5000 into $20,000? That is very reasonable. Can you turn that $20,000 into $50,000? That is very reasonable. Can you turn that $50,000 into $90,000? Once again, utilizing candlestick analysis, the compounding effect of multiple correct trades can produce huge profits with normal market price movements. Take the time to explore a trading market that holds more advantages to the active investor than merely trading stocks. Candlestick analysis, which consistently provides high probability trade situations, becomes very effective when trading fast-moving/highly leveraged commodity trades. Click here for more training information.

Commodity Futures Price, Soybeans
Soybeans

Commodity Futures Price, Lean Hogs
Lean hogs

Chat session tonight at 8 PM ET

Good Investing,
The Candlestick Forum Team


This Week’s Special

2-Day-Commodity Training

Click here for details

Website special reflects current newsletter. If you are reading an archived newsletter you will be directed to Current Website Special.

Sell Commodity Futures

Traders will sell commodity futures when they believe that the price of the commodity will drop substantially between the time they sell the commodities contract and the contract settlement date. The trader will rarely hold contracts to settlement but will buy a commodity futures contract with the same settlement date in order to exit the commodities trading position. When the spot price is sufficiently below the contract price it is profitable to sell commodity futures and then buy at the lower price to profit from trading commoditiesTraders will commonly use both fundamental and technical analysis tools in order accurately predict commodity price movements. Technical analysis tools such as Candlestick analysis have helped commodities traders for centuries in anticipating how a commodity will trade in coming hours, days, weeks, and months. Anyone beginning commodity futures trading will do well to take Commodity and Futures training in order to understand basic commodity trading and to profit by successfully trading commodity futures.

Although a trader will enter into a contract to sell commodity futures he or she will only rarely deliver on the contract. This is the business of producers and buyers of commodities and is called hedging. In this case a gold mining company may sell gold futures or an agricultural cooperative may sell corn futures. An oil company could, in fact, sell oil futures. In each case the seller will be in the business of the commodity in question and will, in fact, be able to produce the commodity for delivery. The company is hedging as a technique of controlling investment risk. This is a common practice and the backbone of the commodities markets. The large volume and liquidity caused by large buyers hedging risk provide the trader with an excellent opportunity to buy commodity futures or sell commodity futures for profit. The trader learns to predict market movement with the use of Candlestick pattern formations and similar technical analysis tools in order to decide whether it will be profitable to buy or to sell commodity futures.

Although a trader may sell commodity futures with settlement dates long in the future he or she need not wait for the settlement date to exit the contract. A commodity trader will watch the market for the commodity using market price tracking and prediction tools like Candlestick charting techniques. When a gap opens up between the contract price for the commodity future and the current commodity futures price the trader can exit his of her position for a profit and never worry about sleeping through the settlement date and having to deliver several hundred head of live cattle to a stockyard in Kansas City or Chicago! Like much of trading derivatives the trader enjoys a fair amount of leverage when he or she decides to sell commodity futures. With a relatively small investment compared to the actual price of the commodity, in contract volume, the trader can make a substantial profit as compared to his invested capital by careful and well practiced use of technical analysis using Candlestick basics.


Market Direction

Why did candlestick investor’s buy aggressively on Wednesday while other investors invested timidly? The candlestick investor had a very high probability trade signal being confirmed. The Inverted Hammer signal is one of the 12 major signals. It does not occur as often as the other signals, however when it does occur, the results can be depended upon for its high percentage correct trade results. A candlestick Inverted Hammer signal, followed by a positive open the next day, will result in somewhere around a 95% probability the uptrend has started. With probabilities like this, the candlestick investor can invest aggressively upon seeing the confirmation. This is what we witnessed in the Dow on Wednesday. Tuesday formed an Inverted Hammer signal. Wednesday’s pre-market futures were opening positive. A number of individual stock charts were setting up for very bullish price move.

Sell Commodity Futures, Dow

DOW

Being able to analyze the direction of the market creates a huge advantage for the magnitude and aggressiveness an investor can enter a trade. Knowing the probabilities of a successful uptrend on an Inverted Hammer confirmation, buying immediately into individual stock charts that were confirming price patterns becomes an easy process. Where is a good portion of profits usually generated? Just as the trend is turning. There is a rush for investors to get back into a price move once they see a reversal has occurred. Fortunately, the candlestick investor can take advantage of the reversal immediately where most investors will require additional confirmation.

Being prepared for a bullish move in the markets allows for aggressive buying into individual charts that are showing high probability/high profit trade situations. PWER was purchased on the open today when the markets were confirming continued positive moves after the Inverted Hammer confirmation. A positive move would have revealed a breakout of an obvious resistance level. Knowing the expectation of a breakout, this allows an investor to be participating in a price move that has big profit potential.

Sell Commodity Futures, PWER

PWER

The investment psychology behind candlestick signals is very simple. This makes the logic very simple for applying positive trade situations. Unfortunately, most investors learn how to invest based upon the sage advice that comes from Wall Street. As has been experienced through many years, the accepted practices of the Wall Street culture provides mediocre returns at best. Candlestick analysis pinpoints the high profit, low risk trade situations. This technique of investing permits an investor to control their own profitability. The analysis of which signals and patterns can produce the biggest profits is not a difficult process to learn. The Candlestick Forum provides a two day training program that puts the logic that is built into candlestick signals into a very orderly learning process. This is not theoretical information. This is the nuts and bolts that has been utilized for centuries for very successful rice trading. You may not have any background in technical analysis. With candlestick signals, you do not need it.

The Candlestick Forum two day training program, scheduled for July 10 and 11 has been postponed until July 24 and 25th. If you have been attending the Thursday night and Monday night training sessions, you should have noticed the methodical, common sense applications used for analyzing trades. Candlestick analysis, unlike fundamental analysis, reveals what prices are doing, not what prices might do in the future. If you are serious about improving your trading and investing techniques, please take the time to attend a two-day training session. You will be amazed how much more clearly you understand the concept of candlestick analysis when it is presented in an orderly manner. Click here for more details.

Chat session tonight 8 PM ET
Good Investing,
The Candlestick Forum Team


Current Website Specials

Commodity & Futures Training 

Training Webinars 

Candlestick Technical Analysis Webinar 

 Options Training Webinar  

Click here for details

Website special reflects current newsletter. If you are reading an archived newsletter you will be directed to Current Website Special.

Buy Commodity Futures

Traders buy commodity futures in the expectation that the spot price on the commodity contract settlement date will be higher than the contract price. The trader will rarely accept delivery when they buy commodity futures. They will sell an equal quantity of the commodity, thus exiting the contract. The only ones who will actually deliver or take delivery of commodities are the producers and their customers. These traders are hedging when they buy commodity futures or sell them. For example gold mining company may sell gold futures and an oil refiner may buy oil futures in order to lock in a competitive price for the next months or years. It is possible to buy commodity futures on oil and other energy products several years into the future. Trading commodities requires a basic knowledge of the commodity in question and ongoing fundamental and technical analysis in order to competently anticipate commodity price trends. To learn how to buy commodity futures engaging in Commodity and Futures Training is wise. The use of very visual technical analysis tools such as Candlestick chart analysis can lead to profitable trades in the commodities markets.

Hedging commodities by producers and their customers goes back to the beginning of Candlestick basics in ancient Japan when rice traders learned to let the market tell them what the market would do. The traders who developed Candlestick charting learned that market history repeats itself. This repetition of Candlestick pattern formations allows traders today to buy commodity futures with an accurate sense of where the market is going next and how to engage in profitable commodity trading. When producers and customers hedge they are guaranteeing themselves a set price at a future date. This is a form of insurance and means of managing investment risk. The constant buying and selling of commodity futures by the main players in the commodities markets provides a baseline liquidity and stability to commodity trading. The addition of traders speculating on market activity adds to market volume and liquidity making technical analysis more accurate and typically makes Candlestick trading tactics even more successful.

Those who buy commodity futures are buying contracts for large quantities of live cattle, gold bullion, crude oil, and other commodities. However, the commodity market offers the trader leverage so that he or she need not provide the money to pay for the entire contract. To buy commodity futures the trader will typically pay several percent of the contract price. The leverage in buying commodities can lead to substantial returns on investment. The leverage can also lead to losses exceeding initial investment. Because of the potential market volatility in trading commodities the trader is well advised to stay in close touch with his or her investment. When a trader decides to buy commodity futures the trader is not obliged to keep the contract until the settlement date. If Candlestick analysis predicts that commodity futures prices will move in a profitable direction the trader can be ready to sell an equal contract and exit his or her position with a profit. If, as can happen, a technical analysis tool such as Candlestick chart formations predicts an unprofitable market move the trader will be able to exit the position before experiencing substantial losses.


Market Direction

Candlestick analysis utilizes the information built into candlestick signals along with other indicators. Being able to analyze multiple indicators helps the investor see whether there has been a change of investor sentiment that is meaningful. The three predominant indicators should be candlestick signal itself, the direction of the stochastics, and the trading in relation to the tee line. Although the Dow traded indecisively today, with some elements of bullish participation, the stochastics were still heading toward the oversold condition and the trading remained below the tee line. The positive trading during the afternoon ‘might’  have caused the bears to cover short positions. However, the overall trend did not show any change in investor sentiment. If bearish, the positive trading in the markets during the late afternoon might have been uncomfortable but nothing that would have instigated reversing positions.

Buy Commodity Futures, DOW

DOW
The use of the tee line, along with candlestick signals, produces high probability trade results. As illustrated in the July Wheat chart, the past two weeks of trading consisted mostly of indecisive Doji days. This revealed the possibility of two trend potential’s. Either this was a resting stage during uptrend or the trend was about  to reverse. Although that may seem like an obvious analysis, the function of the tee line makes the trend direction much easier to diagnose. The lower open today was confirming the series of Doji’s to the downside. Friday’s close below the tee line made the trade decision extremely easy. A lower open on Monday would warrant immediately shorting  of July wheat. The T line adds an excessive amount of credibility to the visual information conveyed by the signals. A trader is able to establish a short position was much more speed and confidence.

Buy Commodity Futures, July Wheat

July Wheat

The visual aspects of candlestick analysis allows an investor to very quickly evaluate what is occurring in investor sentiment. The speed in which a trend can be analyzed allows the candlestick investor to enter trades at  more opportune times. Where other trading techniques would require another day or two of confirmation, the candlestick signals provide valuable information immediately. Most investors learn how to invest with the wrong perspectives. This is due to normal human nature anticipating what price movements ‘should’ do. Reality shows that price movements usually move opposite of the normal investment thinking. This often debilitates an investor’s ability to make profits for many years, until they learn through hard knocks how prices actually move. Fortunately, the common sense investment practices built into candlestick signals allows an investor to correct their misguided thinking process. Learning how the candlestick signals are formed is a powerful training process that develops the correct insights into mastering profitable trading. This is not rocket science! This is merely learning the common sense investment principles through a graphic formation.

Chat session tonight 8 PM ET
Good Investing,
The Candlestick Forum Team


Current Website Specials

2-Day- Training Webinars 

Candlestick Technical Analysis Webinar

 Options Training Webinar

           Perfect for Beginners to Advanced Traders
Learn how to pick market-beating stocks.

Click here for details

Website special reflects current newsletter. If you are reading an archived newsletter you will be directed to Current Website Special

Playing The Stock Market – Made Easy With Candlestick Analysis

laying the stock market becomes a much easier process when knowing which direction the markets are moving. The information incorporated in the Candlestick signals makes analyzing the market direction very easy. When playing the stock market, profits expand dramatically when being positioned correctly in the trends.

Understanding what the Candlestick signals demonstrate when in the overbought or oversold conditions allows the Candlestick investor to greatly reduce market exposure risk. Most investors playing the stock market want to be long all the time. The advantage of the Candlestick signals allows an investor to analyze whether to be long, short, or have positions in both directions. Having the ability to analyze the signals correctly makes analyzing the market direction very easy.

The past few weeks, it has been recommended to be positioned towards the ‘long’ side, although not aggressively. The analysis of the market indicated that a pullback was in progress but not a very convincing pullback. Under these conditions, specific sectors/stocks produce some very good profits on the long side. Had the Candlestick signals illustrated more severe selling possibilities, a different strategy would have been put in place. This summer, usually the slow time of year for trading, has produced some significant gains while playing the stock market.

Market Direction

As can be seen in the Dow chart, the decline over the past month and a half has been very slow and calculated. Numerous indecisive trading days revealed that there was no great urgency to take money out of the markets. With that analysis, putting investment funds into the strong sectors was not going to be influenced greatly by severe negative market sentiment. A large number of stocks were showing buy signals once they came back and tested the 50 day moving averages. This provided on another indication of the presence of buyers in the market.

Over the past few days, the Dow has shown some good bottoming signals as the stochastics were turning up out of the oversold condition. Monday formed a Bullish Engulfing signal. Although Tuesday sold off again, it produced a significant bottoming signal. Note how the lows of both Monday and Tuesday were exactly the same. This created a Tweezer Bottom. A Tweezer Bottom has significance in that it illustrates a level where the buyers step in more than once. Wednesday’s trading also produced a tail to the downside that almost tested the same a low level. The strong close on Wednesday formed a second Bullish Engulfing signal in the last three days. This would be a strong indication that the buyers have bottomed out the markets.

Playing the Stock Market, Dow

The NASDAQ formed a Bullish Engulfing signal right at the 50 day moving average. The next day it formed a Doji/Hammer signal followed by a bullish candle that breached the 50 day moving average. The stochastics have now turned back up. All this occurred when the news reports were telling how terrible the oil shortage may be. Continue to buy on strength.

Playing the Stock Market, NASDAQ

Option Trades – The Candlestick signal analysis makes for some very successful option trades. Being able to analyze what the signals are doing, in respect to creating a high profit pattern, allows for the implementation of high profit option trading strategies.

Stock Charts With Rising Trend Patterns – The Upside Tasuki Gap

Stock charts work equally well applied to individual stocks or to the major indices. Stock charts with Rising Trends indicate whether investor sentiment in the current market is Bullish or Bearish. On individual stock charts with rising trends, the Candlestick Signals help analysts spot the trend. Technical analysis is a skill that improves with practice. Candlestick stock charts quickly advance the learning curve for interpreting patterns. The Candlestick Forum provides weekly newsletters with specific stock charts of interest in the current market. We encourage you to signup for our free newsletter and join us each Thursday for our free stock chat.  These stock chat sessions, with Stephen W. Bigalow, review current market conditions and specific stock charts showing high profit potential trades.
This article focuses on identifying the UPSIDE TASUKI GAP, a Bullish Continuation Pattern. If you are new to trading, you will also want to review the 12 Major Candlestick Signals and Secondary Candlestick Signals.

Upside Tasuki Gap

UPSIDE TASUKI GAP

(uwa banare tasuki)

Description

The Upside Tasuki Gap is found in a rising trend. A White candles forms after gapping up from the previous white candle, as shown in the above illustration. The next day opens lower and closes lower than the previous day. If the gap is not filled, the Bulls have maintained control. If the gap was filled, then the bullish momentum has come to an end. If the gap is not filled, it is time to go long. The definition of a Tasuki is a ‘sash that holds up one’s sleeve.’

Criteria

  1. An uptrend is in progress. A gap occurs between two candles of the same color.
  2. The color of the first tow candles is the same as the prevailing trend.
  3. The third day, an opposite color candlestick opens within the previous candle and closes below the previous open.
  4. The third day close does not fill the gap between the two white candles.
  5. The last two candles, opposite colors, are usually about the same in size.

Pattern Psychology

Explaining the Tasuki Gap is simple. The Japanese place significance on gaps. When one appears in the middle of the trend and is not able to fill itself on weakness the next day, the strength is still in the uptrend. The pullback day is now construed as being a profit-taking day.

Back to Continuation Patterns

Stock Market Technical Analysis Simplified With Candlestick Signals

Stock market technical analysis is dramatically improved when applying Candlestick signals. Working off the premise that the Candlestick signals are the cumulative knowledge of everyone who is buying or selling during a specific time frame, the evaluation of technical trends becomes better formatted when understanding what the signals are telling you. The effectiveness of Candlestick signals in stock market technical analysis is more clearly evident in the past couple of weeks when experiencing world events such as terrorist attacks.

Stock market technical analysis using Candlestick analysis allowed for a trading strategy on the morning of the bombings. The Candlestick signals indicate what investor sentiment is doing during any particular time frame. What were the market conditions on the morning of the London bombings? The stochastics were in the oversold condition. The previous two weeks had been showing Candlestick bottoming signals. Two sets of Morning Star signals had formed as stochastics had approached the oversold condition. This stock market technical analysis, without an extracurricular world event, was indicating that investor sentiment was starting to turn bullish once more.

With this stock market technical analysis in mind, upon hearing the news of the London bombings, an event that could dramatically influence investor sentiment, a trading strategy could be implemented. Knowing that the markets were already in a short-term oversold condition, where the Dow had appeared to hold the 10,300 level, a simple analysis could be made after hearing the news. Our stock market technical analysis indicated to allow the Candlestick signal of that day dictate what our strategy should be.

Utilizing stock market technical analysis in this manner becomes very simple. What was going to be the Candlestick formation that day? The markets immediately sold off that morning. They did so with good strength very early in the day. What should become the investment strategy? Our stock market technical analysis already told as we are in an oversold condition. Our Candlestick signals indicated that buying had been trying to start for the past two weeks. Prices were already down big early in the day. As we had advised in our members’ morning comments, it was a day to hold the long positions until we saw what Candlestick formation was going to occur. The candlestick charts clearly identify when signals may occur.

Had the day closed at the lower end of the trading range, it would have provided a completely different scenario than the formation of a Hammer signal. The Hammer signal revealed that investor sentiment was not in a massive selling mode. This provided the signal to buy aggressively upon seeing more strength the following day.

HAMMERS
(Takuri)

Hammers and Hanging Man

Description

The Hammer is composed of one candle. It is easily identified by the presence of a small body with a shadow at least two times greater than the body. Found at the bottom of a downtrend, this shows evidence that the bulls have started to step in. The color of the small body is not important but a white candle has slightly more bullish implications than the black candle. A positive day is required the following day to confirm this signal.

Criteria

  1. The lower shadow should be at least two times the length of the body.
  2. The real body is at the upper end of the trading range. The color of the body is not important although a white body should have slightly more bullish implications.
  3. There should be no upper shadow or a very small upper shadow.
  4. The following day needs to confirm the Hammer signal with a strong bullish day.

    Signal Enhancements

    1. The longer the lower shadow, the higher the potential of a reversal occurring.
    2. A gap down from the previous day’s close sets up for a stronger reversal move provided the day after the Hammer signal opens higher.
    3. Large volume on the Hammer day increases the chances that a blow off day has occurred.

    Pattern Psychology

    After a downtrend has been in effect, the atmosphere is very bearish. The price opens and starts to trade lower. The bears are still in control. The bulls then step in. They start bringing the price back up towards the top of the trading range. This creates a small body with a large lower shadow. This represents that the bears could not maintain control. The long lower shadow now has the bears questioning whether the decline is still intact. A higher open the next day would confirm that the bulls had taken control.

    Hammer, Windows Media Compatible

    Market Direction – The series of Morning Star signals, confirmed with the bullish candle after the London bombing Hammer day, started the market uptrend. Friday, an option expiration day, started to show some toppiness. Both the Dow, the NASDAQ, and the S&P 500 showed indecisive trading. This was not unexpected on a Friday in the summertime and on an options expiration day. However, the stochastics in all of the indexes have now reached the overbought area.

    It would not be unusual to see some pullback occurring from these levels. This pullback would be more of a profit-taking process versus a reversal. The uptrend appears to be intact. The fear of the feds continuing to raise interest rates as well as oil prices in high trading areas has not produced any euphoric buying as of yet. This becomes a good indicator that the uptrend should persist.

    Stock Market Technical Analysis, Dow

    If a pullback should start appearing, with the evidence of selling starting on Monday or Tuesday, a logical pullback target would be the 50 day and 200 day moving averages. Weakness, confirming Friday’s Doji signals, would be the time to be taking some profits from this recent rally. The strategy, after the test of the MA’s, would be to analyze which sectors appear to be the next strong movers.

    Stock Market Technical Analysis, NASDAQ

    If the markets start pulling back from here, anticipating that the markets are in an uptrend, the Candlestick signals make it very easy to identify when the pullback is over.

    As illustrated in our recommendation of CTTY, once the breakout occurred and the profit-taking came into the stock, the Inverted Hammer, followed by a Bullish Engulfing signal, made for a very profitable trade. CTTY formed another Inverted Hammer on Thursday with some confirmed buying on Friday. Watch for the next leg up.

    Stock Market Technical Analysis, SCITY

    There are always opportunities being revealed when Candlestick signals are used for finding high profit trades.

Swing Trading Refined Using Candlestick Signals!

Candlestick signals become important for swing trading. Understanding what the signals are telling you will produces a very accurate format for swing trading as well as all other forms of investing. Swing trading, with a short-term outlook, requires being able to see exactly what the trends are doing over a 3 to 10 day period. The use of Candlestick’s become much more important especially in a market trend that is not showing very much conviction one way or the other. Understanding what the Candlestick signals are telling you becomes an important factor for making profits and for limiting losses. Interpreting what the signals are telling you is very easy. Whether swing trading, day-trading, or long term investing, the probabilities of being on the correct side of the trade grows dramatically when utilizing the information conveyed in a Candlestick signal.

Market Direction

As was noted late last week and early this week, two Harami signals indicated that the downtrend had stopped. At that time, with the trend apparently bottoming midway between the 50 day moving average in the 200 day moving average, a quick analysis would have suggested an up move to test either the 20 day moving average or the 50 day moving average. However, Thursday produced a doji, demonstrating indecision, and Friday created a bearish candle in the Dow, that closed more than halfway down the bullish candle the day prior to the doji. The last three days formed an Evening Star signal. A true Evening Star signal would be witnessed when the stochastics are in the overbought area.

Swing Trading Refined, Dow

Dow


Even though the Evening Star signal did not occur in overbought area, the formation still has to be evaluated as to what is the investor sentiment appearing to be at this time. Very simply stated, after Thursday’s doji, there was an opportunity for the Bulls to continue the rally. But we saw that the selling had stepped back in. Had we seen a bullish day on Friday, the evaluation of the market trend would have been simple, they are still moving this market up. After the big sell-off on Friday, and the stochastics coming out of the oversold area but turning back down, now allows us to analyze what Monday’s market action could produce.

Before the appearance of the two haramis last week, the Dow’s pullback had been fairly severe. The projection had been that it may test the 200 day moving average down near the 9800 level. The market action, as seen this past week reveals a mild bounce in a down-trending market. Friday’s action, after the doji, and forming a an evening Star signal, should now tell us that if we see weakness on Monday, the last weeks bounce may be over and we are now still heading for the 200 day moving average.

Is this a complete change of projections for just a few days ago? Yes, but that is what using the candlestick signals tell you to do. What could have been the possibilities from the market indications a few days ago has been completely altered by what the candlestick signals are telling us now. That is the whole premise of using candlestick analysis. It changes the investment strategy from being positioned in the direction of what you ” think” the market is going to do to a market strategy based upon what the candlestick signals are indicating the investor sentiment is now.

What may have been the correct analysis five days ago may not be the same analysis today. Most investors lose money because once they make an analysis of the market direction, their ego holds them to that analysis versus being willing to alter their analysis when things change, whether it be three days, three weeks, or three months. What looked like could be a test of the 50 day moving average in the Dow just a few days ago, now has the probabilities reverting back to testing the 200 day moving average if further weakness as seen in the market on Monday.