Doji Candlestick

A Doji represents the equilibrium between supply and demand in the markets. This signal is distinct in that prices open and close at or near the same level, indicating indecision of investors. If prices finish very close to the same level, then either a very small real body, or no real body is visible, and you therefore have a Doji candlestick. When learning to read candlestick chart patterns, the Doji if often the first discussed and deemed the most important. While it is not wise to use this candle alone, when online trading, the Doji marks the beginning of a minor or intermediate trend reversal, and is therefore very important to recognize.

The appearance of a Doji after a long uptrend is a warning to investors that the trend is either close to peaking, or has already peaked in the open markets. On the other hand, after a long downtrend the exact opposite is true and prices have been forced down. There are four types of Doji candlesticks that investors must learn before day trading stock online using Japanese candlesticks. These four types include the common Doji, the long-legged, the dragonfly, and the gravestone. The basic Doji signal was already discussed however the three additional types of Doji signals are explained below.

  1. Long-legged Doji – this Japanese candlestick signal has a long upper and lower shadow that is almost equal in length, however the trader should observe the candle’s close in relation to the midpoint. A close below the midpoint of the candle indicates weakness. This signal indicates that prices traded well above and below the session’s opening level, but the end result shows little change from the open.
  2. Dragonfly Doji – this signal forms when the open, high, and close are equal, and the low creates a long lower shadow. This signal indicates that sellers drove the prices lower during the session, however by the end of the session the buyers pushed the prices back to the opening level and the session high. This signal looks like a “T” with a long lower shadow and no upper shadow.
  3. Gravestone Doji – This Doji candlestick looks like the opposite of the dragonfly thus forming an upside down “T.” It has a long upper shadow and no lower shadow, and it forms when the open, low and close are equal. The high is what creates the long upper shadow. This candlestick trading signal indicates that the buyers drove prices higher during the session, and by the end of the session, the prices came back up to the opening level and the session low as a result of the sellers.

Japanese candlestick stock trading is an easier and more precise way to make profits in the stock market, in comparison to your basic line and bar charts. Continue to learn about other Japanese candlestick signals, in addition to the Doji candlestick, in order to be truly successful in the stock market.


Market Direction

What creates a reversal in a market? Investor perceptions! On any given day a reversal can occur, not based upon a change the fundamentals, but a change of investor sentiment. Crude oil pulled back from the $145 level to the $130 level. Will that have any significant change of company fundamentals? Probably not but the fact that the perception is that with crude oil prices heading lower, things could get better for equities. The fundamentals did not change in the past few days, investor perception changed.
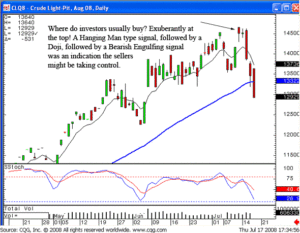
Doji Candlestick, CL
 
CL

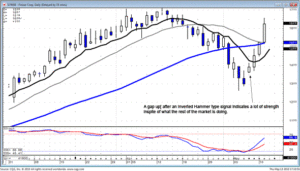
So what becomes the primary scan criterion if there appears to be a reversal in the markets? Literally hundreds of stocks showed reversal signals in the past two days. How does an investor scan for the best possible potential price moves? Candlestick analysis makes that a fairly easy process. Our Candlestick Forum training CDs constantly illustrate which reversal setups have the highest potential price moves. Knowing which direction the market is moving is the first facet for finding the high profit movers. Candlestick investor’s have the benefit of knowing whether a price move has credibility or not. Witnessing candlestick signals at the reversal area lends more credence to the new trend. The Dow formed a bullish engulfing signal after a spinning top. A close above the T-line revealed the Bulls did not have any apprehension at that level.
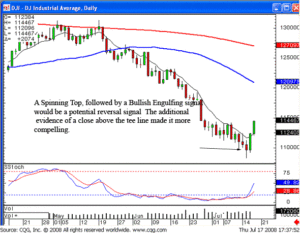
Doji Candlestick, DOW
 
DOW

The steps for finding the highest potential trades in the new market direction are relatively simple. A scan for the strongest reversal signals in the list of sectors can be done just as easily as an individual stocks scan. Next, identifying the strongest reversal signals such as a candlestick signal followed by a gap up or a Kicker signal or the development of a price pattern move would create the best probabilities of be an in a strong stock move.
Once the sector or sectors that are showing the strongest reversal signals are identified, identifying the individual stocks in those sectors that have created the strongest reversal signals become the list to work off of. This is merely simple logic. Where are the identifiable strong signals? They will usually be in the strongest sectors.
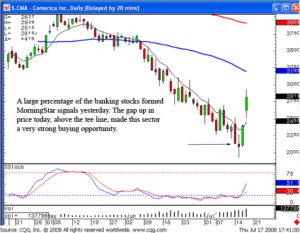
Doji Candlestick, CMA
 
CMA

Many investors have a problem taking profits. Candlestick analysis greatly relieves the fears related to coming out of a position. Good profits were made in the oil sector and the mining sector over the past four weeks. Why were the oil stocks acting strong? Because crude oil prices were steadily rising. Why was the market in general going down? Because crude oil prices were steadily rising. When was it time to take profits in oil stocks? When crude oil prices started breaking. This provided a double reason for taking profits. First of all, when crude oil prices start dropping, the first a knee-jerk reaction would be to sell oil stocks. That works for the short term most of the time. However, there is the additional factor. For those investors that have made good profits in oil stocks when the market was going down, they now have a pool of funds to pull from for the purchase of other sectors that may now benefit from a new market rally. Will oil stocks go higher? More than likely, but for the short-term, the candlestick signals reveal the probabilities are extremely high that it is time to be out of that sector.
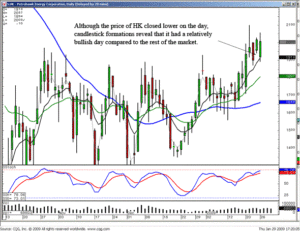
Doji Candlestick, HK4

HK

Candlestick signals indicate what is actually occurring in prices. We may think we can analyze what is going on in a specific market fairly well but that is not important. What we think as an individual has nothing to do with what is going to occur in the market or a stock price. Let the market tell you what the market is doing. If you learn how to use candlestick signals effectively, you will completely alter your analytical processes.

Good investing,

The Candlestick Forum Team


Training Specials

2-Day Seminar Package with $1000 in bonus products. View now
Save $250 for early registration for Sept 20 & 21 2-Day Online Training Clinic
View now
Quick-start Trading Package for beginners – 25% Off 
View now
Website special reflects current newsletter. If you are reading an archived newsletter you will be directed to Current Website Special.

Penny Stock Trading

Penny stock trading is the trading of commons stocks that are sold for less than one to five dollars for each share. Penny stocks are also known as micro cap (or nano) stocks which normally trade for under five dollars per share.  Penny stock trading takes place on the Over the Counter Bulletin Board (OTCBB) or the Pink Sheets, and therefore penny stocks are also referred to as over the counter stocks. These smaller stocks are typically offered by smaller struggling companies or newer companies. They haven’t proved that they are stable enough to move to the larger stock exchanges such as the New York Stock Exchange. Penny stocks are determined by their share price, per the SEC, and not their market capitalization or listing service.

Penny stock trading can riskier than trading regular stocks and should therefore be treated as seriously as trading regular stocks found on the NYSE. When penny stock investing, it is important to note that there are four disadvantages to investing in this type of stock. First, there is a lack of background of the companies traded in these small amounts. These companies have little business history or could potentially have a very negative business history. Before you begin to trade penny stocks, you must research each company to determine their potential. If the company is not headed is a good direction, then you won’t make any money by buying shares in the company.
Second, there is limited information regarding the company’s financial status when penny stock trading. It is hard to research each company because the OTCBB and Pink Sheets do not have the same strict reporting requirements as the major stock exchanges. Without this valuable information, it is very difficult for investors to invest wisely, especially if they don’t take the time to research. Third, most penny stocks are illiquid. This is due to the fact that there is no interest in the future potential of the stocks which leads to lower share prices. Lastly, penny stock trading has tax consequences for day traders. For investors who are day trading penny stocks, it pays to work with a tax specialist to ensure awareness of the tax consequences and benefits involved.

Investors new to penny stock trading will find it beneficial to practice online paper trading before trading with real money. Paper trading is a great way to find out whether or not a particular system is right for you without finding out with real money! It is definitely possible to make a nice living investing in penny stocks of small or future businesses, but you must be sure that you find reliable resources and tools for building your list of penny stocks to watch. Once you understand what to look for in a small company, you can begin to trade with real money instead of paper trading. Just be sure not to fall for hot penny stock scams where manipulative investors pump and dump stocks! Rely on your sources and judgment and invest in companies that you believe are a sound investment.


Market Direction

The mid-to-late summer trading activity is usually relatively boring in the stock market. The lack of volume obviously shows that most traders are outside doing other things. This usually makes the efforts to produce profits more difficult. Fewer traders equal less movements. However, utilizing candlestick analysis still allows an investor to participate in the trades that are creating opportunities. The scanning techniques are relatively simple. Using the simple steps found in the Candlestick Forum’s training CD, “Scanning for High Profit Trades” will consistently produce a supply of potentially strong trades. The only difference in the summertime is that the number of potential trades maybe much smaller. But that should not matter. Most investors require only one or two trades each day. It does not matter that those one or two trades come from a supply of three potentially good trades or 30 potentially good trades.

The same criteria, for finding strong trade setups, occur in slow-moving markets as they do in faster moving markets. The different expectations should be obvious. The magnitude of price moves is going to be much smaller as a general rule. Price trends may move in a very choppy slow upward or downward trend. The analysis of the market and individual stock prices have to take into consideration that there will be a different dynamic when less people are around the trade. Fortunately, candlestick analysis always incorporates the Japanese Rice traders’ advice, “let the market tell you what the market is going to do”.

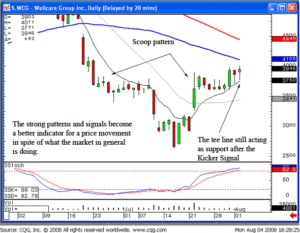
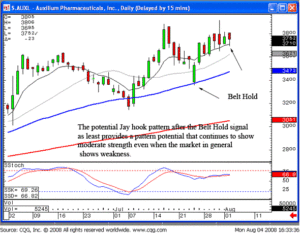
When trading gets slow, the candlestick investor still maintains advantage of being able to use the information built into price patterns. Price patterns are created by the same investor sentiment time after time, not necessarily influenced by what the markets are doing in general. The Jay hook patterns, the cradle patterns, the Fry pan bottom pattern will all work equally well during any market conditions. As with individual candlestick signals, there may be fewer patterns identified. Once again, it may only require one or two strong price patterns during a sluggish market to satisfy most investors.

Penny Stocks Dow

DOW

Establishing positions in chart patterns that are setting up great two advantages. If the price does do what it’s supposed to, in spite of general market conditions, good profit to be made. If prices don’t do what they are expected to do, such as a break out to the upside, the price will usually maintain some strength even if the market it is moving severely in the other direction. At least the positions will not normally create large losses.

Penny Stocks WCG

WCG

Penny Stocks, AUXL

AUXL

Candlestick analysis is the accumulation of common sense investment practices throughout the centuries. It not only identifies the big-profit trade potential’s, it incorporates a system of common sense trading practices that provide an easy to establish discipline. The analysis itself identifies investors’ strength and weaknesses. The visual aspects make target projections much easier. Simple entry and exit strategies improve the probabilities of being in and out of a trade at the appropriate times. Simple stop loss strategies can be applied. Candlestick analysis covers the whole spectrum of investing successfully. Many investors find that the training available on the Candlestick Forum does not involve only finding the most successful trades, but it also illustrates all the other aspects involved for successful investing. This is not a difficult learning process. For those investors that have taken the time to accumulate the knowledge built into the candlestick signals, any investing they do in the future becomes better thought out.
Chat session tonight at 8 p.m. ET for members only. Next Thursday the chat session is open to everybody. These are usually good opportunities to invite your friends, relatives, and children to a learning process that may become valuable for them in their future.

Good investing,

The Candlestick Forum Team


Website Special

Major Moving Averages Plus Bonus Video and PDF

Learn to recognize the stock charts with powerful profits.
Combine the precision of Candlestick Patterns
with Major Moving Averages!

Website special reflects current newsletter. If you are reading an archived newsletter you will be directed to Current Website Special.

Stock Traders

Types of Stock Traders
When discussing the different types of traders who trade stock, it is first important to understand what a stock trader is as opposed to a stock investor. Stock traders typically attempt to profit through short term stock trading that lasts anywhere from several seconds to several weeks. Equity is traded on the stock market through the use of technical analysis with the goal to profit from short-term price volatility. There are different types of stock traders that are later discussed in this article, but basically a trader is a person who buys and sells stocks in order to make a profit. Conversely, a stock investor purchases stocks to hold onto for a longer period of time, such as several months to years. Stock investors practice fundamental analysis and they participate as shareholders with part ownership to companies.

The major styles of trading discussed in this article include day trading (including scalping and momentum trading), technical trading, fundamental trading, and swing trading.

Day traders – day traders will typically buy and hold stock between a few seconds to a few hours. The goal is to get in and then get out by selling out of any particular stock for a profit as fast as you can. These types of stock traders do not hold stock overnight in order to prevent from losing out of their gains made that day.

Scalpers – This day trader makes tons of trades each day and their stock trading is restricted to quick and repeated buying and selling of a large volume of stock during a very short period of time. The goal is to earn a small per share profit on each transaction at a minimum risk by exploiting the bid-ask spread.

Momentum Traders – these traders look for stocks that move significantly in one specific direction on high volume, and they attempt to jump on the bandwagon to ride the momentum to their desired profit. These traders trade stocks that are in a moving pattern during the day. The goal is to buy stock at the bottom and sell it at the top.

Technical Traders – These stock traders constantly read stock charts and graphs. They watch the lines on these charts or graphs for signs of divergence or convergence used to indicate buy or sell signals.

Fundamental Traders – These traders trade stock based on fundamental analysis. Fundamental analysis look at things such as earnings reports, stock splits, mergers and acquisitions. They practice long-term investing and hold onto stock for several months to several years.

Swing Traders – Swing trading stocks is similar to day trading stocks, but swing traders hold their stocks longer. They also attempt to predict future price movements over the short-term but they hold stocks for more than one day, if necessary. Swing traders assume greater risk than day traders because they take a risk by holding onto stock overnight. Day traders, on the other hand, liquidate their stock at the end of each day.

There are many types of stock traders and many different methods available for traders to use. For those new to investing in stocks, be sure to research not only the types of trading that you can do, but also the different methods that you can utilize.


Market Direction

This past week of trading was a perfect illustration of how prices move, not on the basis of fundamentals, but on the perception of fundamentals. It is often asked whether any trading method could anticipate the markets price action of last week. When outside influences, such as government intervention, starts playing into the market, there is no trading method that can anticipate unforeseen actions. However, candlestick charts allow an investor to clearly and quickly analyze what investor sentiment has developed based upon unforeseen actions. This may sound like trying to catch the horse after it is out of the barn. But the big benefit of candlestick analysis is that the candlestick investor at least has a good idea which direction the horse is going.

The results of candlestick signals and patterns becomes a relatively predictable analysis. This is due to one simple factor! Investor sentiment reacts the same way over and over during price movements. There are different dynamics in investors minds when prices are going down. There are different thought processes in investors minds when prices are moving up. Sideways price movements also create common investor reactions. Candlestick analysis is merely the graphic depiction of what is occurring in investor sentiment. It does not take a rocket scientist to evaluate what a price trend “should” do based upon a reoccurring pattern.

An often asked question is what will we learn during a Candlestick Forum Online Training session. The information conveyed by both Rick and Steve has one solid fundamental element. It teaches the investor how to utilize the commonsense investment practices built into candlestick signals. That education includes recognizing the signals and patterns that have a high probability result. Steve illustrates the major signals and patterns that have the capability of producing extensive profits. More importantly, he educates investors to understand the psychology that created the signals and why they work the way they do. This information is an extremely powerful combination. It provides a full understanding of why prices move the way they do, as the professions think. This creates the analytical ability that can be used in any market conditions for the rest of your life. Rick’s knowledge as an extremely strong dynamic for successful investing. Extensive research and practical use allows Rick to combine additional technical indicators to fine tune a successful trading strategy. The utilization of candlestick signals in conjunction with other indicators dramatically improves the probabilities of being in the right trade/position at the right time. Come join us on October 4 and 5, 2008. This today training seminar puts everything in a logical order. Once you have learned the nuances behind successful trading with candlestick’s, you will be able to analyze any trading market that you would like to participate.

Member Chat Session tonight at 8 pm ET will be hosted by Rick.

Good investing,

The Candlestick Forum Team


Scanning Techniques for Higher Profits

Scanning Techniques to Higher Profits – 50% OFF!

Once taught only to Steve’s private clients; now available on CD.
Click here for more details.

Website special reflects current newsletter. If you are reading an archived newsletter you will be directed to Current Website Special.

Elliott Wave

The Elliott Wave Theory
The Elliott Wave Theory was named after an accountant named Ralph Nelson Elliott and he concluded that the movement of the stock market can be predicted through observing and identifying repetitive patterns of waves. This theory bases these market movements on crown behavior, now referred to as the psychology of investing and trading. He determined that crowd’s behavior can be predicted through analyzing wave patterns.

His theory is based on the rhythms found in nature. What this means is that it is suggested that the market moves in the direction of the main trend and that trends are reflected in a five series of waves called impulse waves. Additionally, there exists a series of three corrective waves that move against the trend. (See trend trading). The difference between the Elliott Wave Theory and other similar theories is that his theory suggests that there is not absolute time requirement for these cycles to complete however both the corrective and impulse waves can be seen in long-term and in short-term stock charts.

These waves can also be further broken down into more waves as it relates to Fibonacci numbers. Traders will use Fibonacci indicators as reference points when trading, to predict a retracement versus a reversal. Fibonacci indicators provide an excellent visual map and are extremely accurate when analyzing chart pattern reversals.
There is a very high degree of subjectivity when looking at Elliott’s theory and as a result it is very difficult to find agreement among stock traders. The main disparagement deals with the waves and the fact that it is difficult to tell when a wave begins and when it actually ends. There are no real clear definitions however, the stronger the impulse wave is the stronger the corrections will be. Of course, the weaker the impulse wave is the weaker the correction wave will be as well.

Confirmation when using the Elliott’s theory deals with oscillators and divergence. The Elliott Wave oscillator can be used to choose highs and higher lows in an uptrend and also lower highs and lower lows in a downtrend when helping to confirm proper entry and exit points. Additionally, this theory used divergence between the oscillator and the price for confirmation.

There are so many different technical indicators to use when stock trading that it can be overwhelming. Just be sure that you explore and have an understanding of the basics of the most popular and widely used methods, and then focus on a couple of technical analysis methods that you can use together. Don’t try and use them all or you are causing yourself undue stress. Just become and expert on two to three and use them in your every day trading.


Market Direction

Candlestick signals and formations are extremely powerful for detecting when investor sentiment has changed. The reversal signals clearly illustrate that a  change of investor sentiment is occurring. Conversely, the opposite is true. Candlestick analysis allows for the evaluation of a trend as to whether that trend is continuing in its current direction. This may be a very simplistic statement. However, it is a very beneficial tool for investors. Many investors allow their emotions to let  them to be whipsawed during a trend. If you understand what is required to change a trends direction, you become much more comfortable during the countermoves of a trend. This morning’s trading was a clear example.

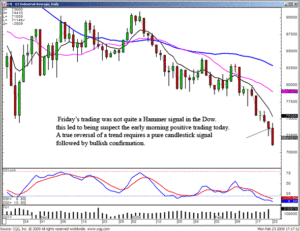
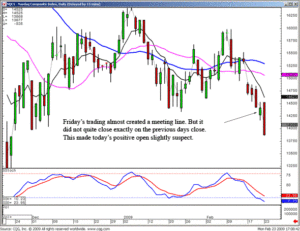
With stochastics in the oversold condition, the Dow and the NASDAQ formed “almost” reversal signals on Friday. The Dow formed a Hammer type signal but did not quite reach the requirements of a pure Hammer signal. The tail was not quite two times the body. The NASDAQ formed a potential Meeting Line signal. However, the close of Friday did not quite close exactly on the close of Thursday. These formations, although relatively close to being potential reversal signals, were not quite reversal signals. These become very important factors when deciding to cover short positions or not. The fact that they were not pure candlestick reversal signals instigated one more requirement. Todays trading needed to show strong bullish confirmation. The markets started out positive this morning but did not move to the degree that would indicate the Bulls had taken over.

Elliot Wave, DOW

DOW

Elliot Wave, NASDAQ

NASDAQ

The downtrend had to be considered still in progress until there was an indication of a strong reversal of investor sentiment. After the Spinning Top formed on Friday, the NASDAQ had the potential of reversing. It gapped higher on the open but immediately started selling off. Had the buying continued after the open, that may have warranted covering short positions. The decision for closing out short positions or selling the short funds did not become an issue as the continued selling proceeded during the day. The lack of a candlestick reversal signal allows for comfortable participation in the market, being heavily oriented toward the short side. As often professed in these newsletters, let the market tell you what the market is doing. Currently, there has not been any indication that the current market sentiment has changed.

Elliot Wave, FAZ

FAZ Short Fund

Candlestick Forum Online Boot Camp – last call – The boot camp training will start tomorrow at 4:30 PM ET. The next four weeks will consist of one hour training sessions on Tuesday and Wednesday afternoons. These concentrated training sessions will deal with one specific topic each day. Each topic will be oriented toward the weaknesses most investors encounter in their investment endeavors. The information provided is information that most investors have never been exposed to. They are aspects of investing that all investors are aware of, they just have not been studied in detail. If you want to take the subjectivity out of your investment thought processes, sign up today for a very detailed, step-by-step investment process that allows each investor to gain control of their own investment abilities.

How do you take the emotions of investing? By understanding each aspect of the investment process in full detail. We all have our weaknesses. Some people have a hard time getting into a position at the right time. Some people have a hard time cutting their losses. Some people have a hard time taking profits. Simple money management techniques eliminate many of the emotional problems. Candlestick analysis is a common sense investment process that allows each investor to control their own investment acumen. Do not miss this opportunity to learn how to trade effectively for the rest of your life.

Chat session tonight at 8 PM ET members only.

Good investing,

The Candlestick Forum Team


This Week’s Special

Fast Track to Trading

The 12 Major Signals and 5-Star Trading package Combined

Learning to make your own investment decisions is easier than you think!

Click here for details

Website special reflects current newsletter. If you are reading an archived newsletter you will be directed to Current Website Special

Best Commodities to Trade

The best commodities to trade will depend upon a variety of circumstances, always including market timing. Commodity groups include energy, food and fiber, grains, interest rates, meats, metals, and stock indices. In all of these commodities markets there are factors that determine whether commodity prices will rise or fall when trading commodity futures. For traders with a great deal of expertise in a given commodity the best commodities to trade may be the most variable as these will be where the most profit potential lies. For the new comer to commodity trading the best commodities to trade may be those with less market volatility and, therefore, less risk of substantial loss. As with all trading it is wise to learn the basics first. Commodity and futures training is a good place to start. Learning the use of Candlestick charting techniques will help the beginning, and seasoned, trader to profit by anticipating price movement in commodities.

Often times commodity trading is trend trading. In the arena of traders there are followers of long term trends and short term trends. The longer the trend the more important it is to do fundamental analysis of the commodity involved. The shorter the trend the more important it is to do technical analysis. In all commodities trading fundamental and technical analysis have their places. For example, a trader who is expecting a long term rise in prices of corn futures will still want use tools such as Candlestick pattern formations to watch daily futures price movement in order to get the best purchase price even though he or she may be holding futures contracts for months or years. In trading commodities it is essential to know when large price movements usually occur. In trading agricultural commodities, such as live cattle commodity trading, a severe winter on the North American Great Plains may result in the deaths of many cattle. This will drive the price of beef up. An astute trader may see a weather map of a severe storm passing over Nebraska and Iowa and anticipate a drop in June live cattle futures.

Just as there is reason for diversifying a stock portfolio there can be reasons to diversify when trading futures on commodities. Although the possible return on investment in just trading interest rates or gold futures may be inviting, hedging in the form of trading a balanced portfolio of commodities may be safer and more profitable in the long run. Factors to consider when choosing the best commodities to trade are market liquidity as well as fundamental trends. For interest rates and currencies the trader will need insight into economics and politics as well as the banking systems of the countries involved. Trading oil futures, energy credits, natural gas futures and the like also require a sense of the economy as a recession can decrease demand substantially. Trading precious metals futures also has a lot to do with the economy and monetary policy. Many who trade in gold believe that the US and other nations will not be able to avoid inflation over time and, as such, habitually trade gold futures in the belief that the precious metal can only go up over time. A view of history will show that this is not the case as when gold prices plummeted in the 1980’s. In the end the best commodities to trade are the ones the trader knows the most about and is willing to follow closely enough to anticipate the market.


Market Direction

No Market Direction today due to traveling.

Chat session tonight 8 PM ET –  Tina Logan will be presenting this Thursday June 10th.

Good Investing,

The Candlestick Forum Team


Current Website Specials

July 2010

2-Day- Training Webinars 

Candlestick Technical Analysis Webinar – July 10 & 11

 Options Training Webinar – July 31st & August 1st

Trend Analysis- 50% OFF

Click here for details

Website special reflects current newsletter. If you are reading an archived newsletter you will be directed to Current Website Special.

Trading Futures Contracts

Futures contracts are contracts on currencies, stock market indexes, or commodities. These contracts attempt to predict the value of these securities at some date in the future. When dealing with commodities, trading futures contracts is a commitment to deliver or to receive a specific amount of a commodity during a specified month at a price that is determined by the futures market. When you sell a futures contract, it means that you have an obligation to deliver the commodity by a certain date and conversely when buying a commodity you have agreed to buy the commodity at a specific price at a specified date. When trading futures contracts, most of the time, the trade never ends in an actual delivery of the asset, but instead these contracts are closed out before the delivery date. The purpose of futures markets in general is to provide a useful and competent means to manage price risks and the purchasing of futures is done through discount brokers and full-services brokers. Futures trading requires that the investors accept price risks from producers with the goal of making a profit.

There are advantages and disadvantages to trading futures contracts, both of which will be discussed in this article. The risks apply more to the speculators and this is due to the fact that futures orders are typically bought on margin. In fact, futures traders only have to deposit five to ten percent, and the rest of the contract can be bought on margin. Additionally, it is very easy to lose your original investment in a volatile market and is therefore suggested that only professionals trade in the future markets. Investors also must be aware of the tax consequences due to the high amount of leverage that can create huge capital gains and losses.

The advantages to trading futures contracts deals with the concept of hedging. The goal is to obtain a perfect hedge when you trade futures. Basically, you can opt to sell your commodity at the current market price or you can “lock in” a price for your commodity to be sold at a specific price at specific time in the future. This comes in handy for farmers who must speculate what their commodity will cost at a specific date in the future. (Many farmers must wait until harvest so they don’t know that the current market price will hold). If the farmer is content with the price of the commodity today, then they will sell the futures contract to guarantee that they will get today’s price at a future date. Additional advantages to online futures trading include the fact that futures markets are very active so you can liquidate contracts quite easily. Basically, trading futures is very useful to reducing any unwanted risk.

Trading futures contracts is a great way to invest money however it is not easy. Many people suggests that only professionals do it, but if you study, understand what you are doing and approach it as a professional would, then there is no reason that it can’t be a great way to invest for you.


Market Direction

Candlestick analysis creates a number of parameters that becomes a built in discipline. The reason most investors do not make money is because of their own emotions. When we make the decision to put our funds at risk, we have also inherently put a piece of our ego to the test. It is our mental capacities that will be judged based upon whether a trade makes money or loses money. When we make money with a trade, our self worth expands greatly. When we lose money on a trade, mentally we judge ourselves as losers, stupid, and many other derogatory feelings that we feel about ourselves. We hate to lose. That is what causes most people to let losses keep growing. Once we decide to close that trade as a loss, we have now solidified the fact that our mental processes were flawed. If we keep the position open, maybe it will come back to positive. Then we would be validated as a winner, not a loser.

Unfortunately, the markets did not care what you do or what you think. The markets are going to do what they are going to do. How you perceive what those movements may be has nothing to do with the market movements. Candlestick analysis provides a visual format that greatly reduces the emotions of investment decisions. The markets move in patterns. Candlestick signals help illustrate what is occurring and has occurred many times in the past. The caveat to that statement is adding “with a high degree of probability”. Candlestick analysis is merely the evaluation of investor sentiment. Investor sentiment works in a specific manner most of the time. Utilizing the information that is built into candlestick patterns and signals provides a visual format for recognizing the next reoccurring price movement.

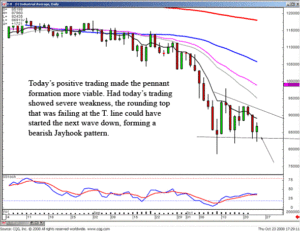
This is powerful information. This makes evaluating what is occurring in market/price trends at critical levels. This is clearly evident in the Dow. The recent congestion of the past two weeks is providing analyzable forecasts for what the market might do from this area. The trend analysis becomes much easier knowing what occurs after the completion of specific patterns. As described in earlier newsletters, the dumpling top forecasts the potential of an extremely strong downtrend. Once that downtrend has completed, a new set of pattern potentials present themselves. The J-hook pattern, for example, is usually a result after an extremely strong price move. The recent strong downtrend could be the precursor to a bearish J-hook pattern. That possibility still exists if the Bears can push prices to new lows over the next few days. The failure of the Bulls to be able to close trading above the T-line provides more credence to the bearish J-hook set up.

Futures, DOW example

DOW

Today’s bullish trading provided more evidence of a possible pennant formation. Positive trading from this level would make that prognosis more viable. In either case, an investor can make a reasonably intelligent assessment of what to do based upon what patterns may be setting up. Continued weakness from this level would warrant shorting positions or buying the short funds. Witnessing more bullish trading would make the pennant analysis more feasible. This would lead to looking for long positions. However, any long positions established would be done so with taking quick profits if the top of the pennant formation showed resistance.

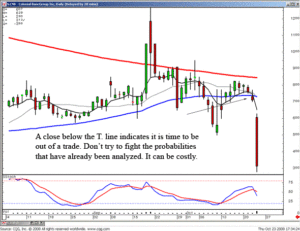
Candlestick signals forming at support and resistance levels gain that much more credibility when analyzing what new price pattern could be developing. The T. line has become a very valuable technical level to watch. Buying a position after a candlestick buy signal can be maintained as long as it does not close back below the T. line. The research that has been performed involving the T. line produces a simple format for when to stay in and when to get out of a position. The Japanese rice traders did not have this technical indicator to help confirm candlestick signals. The benefit we have today is adding computer-aided technical indicators to help improve the probabilities of candlestick signals.

Futures, CNB Example

CNB

Because we are constantly trying to find trading techniques that dramatically improve our probabilities of making money, to disregard what has already been proven now becomes a detriment to your account balance as well as your mental perspectives. As often stated, this is not rocket science. This is merely combining information continually improves your trading abilities. Learn how to use candlestick signals correctly. Once you do, you’ll have a completely different perspective on how to invest successfully. Your emotions would not continue to be a flaw.
Chat session tonight at 8 PM ET – open to everybody, bring the kids, teach them how to invest correctly at an early age. You do not want them to go through investment hard knocks like most of us had to do most of our lives. Click here for instructions.

If you already have HotComm installed, click here to connect.

Good investing,

The Candlestick Forum Team


Candlestick Analysis Technician

2-Day Training Seminar Package – 40% OFF!

5-Cd Pack with Training Manual
Bonus CD Scanning Techniques to Higher Profits (valued at $187.77)
Double Bonus – Free 30-Day membership to The Candlestick Forum (valued at $97)
Website special reflects current newsletter. If you are reading an archived newsletter you will be directed to Current Website Special.

Commodity Trends

In trading commodities traders follow trends, anticipate market reversal, and use technical analysis tools such as Candlestick chart patterns to trade successfully when a commodity establishes itself in trend or a trading range. Commodity trends vary with the type of commodity. Trends differ over short or long term. However, technical analysis with Candlestick charting will predict future market moves as successfully with corn futures or gold futures as it did in the rice market in Japan during the reign of the Samurai. Trading of commodity trends can be very successful so long as the trader uses both fundamental commodity analysis and technical analysis indicators to verify the probability of the trend lasting or reversing. Learning how to trade commodity trends and market reversal is part of commodity and futures training.

Commodity prices and commodity trends are based on the laws of supply and demand. However, when the exact supply and the exact demand are unknown the market will speculate. Knowing the fundamentals of how a commodity is produced and the depth and breadth of its market is essential to successful commodity trading. Knowing the fundamentals always helps the trader reduce and manage investment risk. However, to profit from trading futures in commodities the trader will need to be able to read the market. Trends tend to establish themselves when the market is in consensus about the prospects of a commodity price. When a recession hits traders in oil futures will want to sell short on the way down and will continue to do so as long as they believe that the price has not reached a fundamental support level. Understanding support and resistance zones is essential in successful trading of commodity trends. With knowledgeable use of Candlestick trading tactics a trader can do well trading commodity trends or predicting and profiting from breakouts.

Long term trends are essentially an organic part of a market. For example, the development of a new seed variety may substantially increase corn production and cause a long term decrease in the price of corn futures. On the other hand a drought in a major crop growing area will probably only raise prices for a year or until the next rains. Knowing and understanding the nature of trends will help the trader profit by them. The longer term trends are typically due to fundamentals. Short term trends in commodities or other trading are typically due to market sentiment. In reading market sentiment the trader will rely on Candlestick analysis to let the market tell him when the market will do. Everyone has the same fundamental information but everyone buys or sells a little differently. The psychology of the market is such that commodity trends feed upon themselves, almost to excess. Knowing when to stay with the trend when to go against it comes with experience and the use of tried and true trading tools such as Candlestick basics. What worked for Japanese rice traders centuries ago can work for traders today.


Market Direction

The major benefit of candlestick analysis is that it can accurately evaluate all markets and all time frames . For the active trader, this is very important information. If you love trading stocks, you have a relatively large market to deal with. However, most of the active trading occurs in the first hour and a half in the final hour. The market trades relatively blasé during the middle part of the day. For an active trader, this can be a problem. Wanting to trade actively during the middle part of the day may lead to pushing trades that should not be executed just for the sake of staying active. There are better solutions.


Commodity markets usually open up 30 minutes to an hour after the stock market opens. They usually close prior to the close of the stock market. This allows a trader to trade actively during the first and last hours of the stock market trading, then participate in some commodity trading during the middle part of the day. This allows the active trading to be spread over the full length of the day. Fortunately, successful commodity trading utilizes the same confirming indicators as stock trading. The charts work equally well on bond charts, currency charts, or any other trading entity that involves human participation.

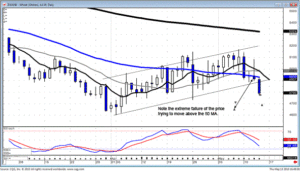
Investing successfully in commodity charts is very simple. It takes the same logic and visual analysis found in stock charts. For example, July Wheat was shorted today based upon a few simple chart analysis techniques. A failure of the 50 day moving average yesterday was an indication to watch for further weakness today. If that happened, the trend channel would be breached. This would set up the possibility of a strong leg to the downside.

Commodity Trends, Wheat
Wheat

Having the ability to recognize when a high probability trade is going to occur creates the opportunity to make much bigger profits trading commodities than trading stocks. The leverage in commodities make say price move extremely worthwhile.

The Dow held up  well today after a few days of strong buying for the most part of the day. The immediate consolidation took the Dow back down to the tee line first thing in the morning. It acted as support. The rest of the day traded relatively strong, considering there was a good amount of profit taking occurring today. The selling strength returned going into the close. This makes the prospects of a strong recovery in the markets more dismal. However, the strong charts still revealed continued strength. Because of the severity of the last downtrend, when buyers came back into the markets, they did so with an extensive amount of enthusiasm. This can be seen in the number of candlestick reversal signals and gap ups in price.

Commodity Trends, Dow Example
DOW

Commodity Trends, FNSR
RHT

Utilizing these simple rules helps an investor trade much more calmly. Many investors get scared out of a trade that is not producing a true reversal signal. They will not attempt to get back in because it would make them look foolish to sell out and then buy it right back. Using the simple rules applied to candlestick signals in the confirming indicators keeps an investor from entering a trade they should not get in and keeping them in trades they should not get out. This benefit allows an investor to concentrate their efforts on analyzing for new trades. Mental time and effort will not be wasted on price trends that are just zigging when the uptrend is still in progress. The benefits of these techniques are more apparent when trading commodities. Small price moves in a commodity trade equats to great differences in profits or losses. Learn how to apply simple trading rules to your investing and you will gain a much better comprehension for when trending prices are merely having small pullbacks.

Commodity traders — Do you know how to evaluate which trade or trades have the highest probabilities of producing profits? Have you ever analyzed two trades that look good. You decide upon placing a trade in one. It doesn’t move, but the other one takes off like a rocket. What could you have done to decipher which one was going to have the greater probability of moving. Not only moving, but moving with a much greater strength. The Candlestick Forum will be providing a two-day commodity trading training session. Candlestick signals makes the opportunity for improving your returns for stock trading dramatically better. Using candlestick signals in commodity trading greatly improves the potential of making huge profits. Join us on May 22 and 23rd for a concentrated two day training session for successfully trading commodities. The analytical techniques found in his training will improve all aspects of your candlestick investing. 

Chat session tonight at 8 PM ET

The Candlestick Forum Team


This Week’s Special

Projecting Price Targets – Quickly learn to spot the most profitable price targets! – BONUS EBOOK with purchase!!!

2-Day-Commodity Training Webinar

Click here for details

Website special reflects current newsletter. If you are reading an archived newsletter you will be directed to Current Website Special.

Children and the Stock Market – When Should They Learn To Invest?

The concept of children and the stock market seems as logical as mixing nitrogen and glycerin in a blender in your kitchen. Children joining the stock market community? Shouldn’t they be playing PlayStation 2 or 3 now? In reality, the combination of children and the stock market and the world’s future is a natural fit. Remember, most of today’s baby boomer investors didn’t have a home computer or video game when they were kids; this generation can save the universe courtesy of Sony and other program creators. There are some keys to introducing your children to the stock market, so let’s get started.

First, it is imperative to start this adventure with a good understanding of stock market basics. You can start by teaching those youngsters that investing is totally different from saving. You might “save” to buy a new bike, but “invest” to have the money for college. Next in the process of combining your children and the stock market would be to cover topics such as portfolio diversification, liquidity, and risk reward ratios.

Ready to give your kids the family fortune yet? Let’s hope not! Before the kids actually start picking stocks and investing with real money, it’s best to start with a mock portfolio. There are a variety of ways for kids or anyone else to practice online stock market trading. There are a number of online games for stock and option investing simulation games. Prefer FOREX currency trading for beginners?  It’s there too. Or if you enjoy the more traditional method, you can do this all on your own by helping your child construct and track his/her own portfolio of stocks. It’s also wise to encourage your children to “invest” in companies that they know, such as Disney, Coca Cola, Nike, or Microsoft.

While in the stock market, you can teach your children to track their investments, practice money management techniques, monitor company performance, research each investment, and track trends in the market. Junior probably has a good idea if Sony will impact Microsoft’s profit when the PlayStation 3 is launched. This is also a great opportunity to begin teaching the concepts of Japanese Candlesticks stock trading to your children in the stock market. Chances are, they will pick up the principles much quicker than poor old dad!

Once you, and your kids, are ready for the stock market, there are a several investment options you can choose from. The safest course is probably finding a mutual fund. Although this is not the most exciting option, there are “kid friendly” mutual funds available, and actually some that provide stock market investing education materials as well. All of the principles your kids have learned apply and the bottom line results are real.

Trading Commodities Online

Trading commodities online has gained popularity for many investors in recent years. Not only are trades executed quicker than when using a real live broker, but commissions are lower as well. While there are many benefits to trading commodities online, investors must also be aware of the hidden dangers with using this method. Both the advantages and disadvantages of trading commodities without the use of a full-service broker will be discussed in today’s article.

Online commodities trading does provide lower commissions than if going through a live full-service commodities broker making it more cost effective to practice multiple strategies at once. Traders are able to practice more sophisticated trades by potentially cutting the cost by about one hundred dollars per trade! For example, commodity trading can be done for fewer than ten dollars per round-turn with most online brokers.

Trading commodities online also allows instant trading without having to contact a live broker to place your orders. Almost everything you could possibly need to trade commodities is available through an online commodity trading account including commodity trading charts, commodity news, and technical analysis programs.

Commodity investing online also has its disadvantages that investors should be forewarned about. There is the potential to overtrade and this has become an increasing problem with the increased use of online trading. Due to the ease of which one can place trades online, this has led to undisciplined and impulsive trading. Additionally, due to lower commission rates, inexperienced investors will get often place trades that they normally wouldn’t, quickly finding themselves in a financial predicament. For some investors, the ease of trading leads to a false feeling of control and independence.

Trading commodities online is also dangerous for new investors who may need a mentor. Online brokers are often discount brokers that do not provide any advice to the new investor, but merely places the trades requested of them. This is great for investors who know what they are doing, and have achieved success in the commodities markets, but for the new investor, it may not be such a great thing. Many new traders make foolish mistakes that they wouldn’t have otherwise made if they had the assistance of a full-service broker. Many feel that the education received from a live broker is well worth the cost for new investors. Live broker offer more value to newer investors than they do to more experienced investors. Many investors suggest starting off with a full-service broker until you attaint the level of knowledge and discipline required to trade successfully. Regardless of which type of broker you decide to utilize, it is imperative that you at least have a mentor to which you can learn from and go to for help.

Many commodities brokers will give you a free trial period in order to test their services. Choosing your commodity broker is one of the most important decisions that you will make in your trading career, so be sure that you do your research. Finding a reputable broker that not only meets your needs but that compensates for your shortcomings will lead you to successful trading when trading commodities online.


Market Direction

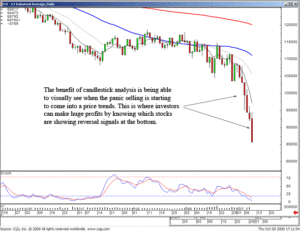
When do people sell? They panic sell at the bottom! The identification of the Dumpling Top pattern allowed for being in the right strategy at the right time. Knowing the results that should occur after a candlestick pattern allows an investor to take advantage of big price moves. That can occur in two different methods. As the market was selling off, having funds in short positions produced significant profits. For those that do not like to go short, sitting in cash was the proper strategy. Sitting in cash has a powerful outcome when used properly. Knowing that the markets are in a severe decline has an obvious ramification. There is panic selling coming into this market. That is probably enhanced with margin calls. The basic premise of candlestick analysis is having a graphic depiction of what is going on in investor sentiment. The charts will show when panic selling is occurring. That has been witnessed for the past three trading days as this downtrend accelerates. There are also some simple signs for when the bottom has finally arrived.

Trading Commodities Online, Dow Example 

DOW

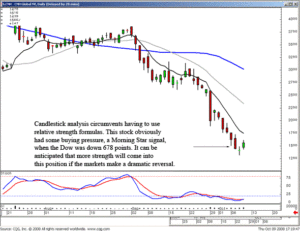
The futures continued to trade lower after the close today. This was after the Dow was down almost 700 points. The NASDAQ clearly negated the Inverted Hammer signal with a 95 point drop. What would indicate final capitulation? A gap down on the open tomorrow. A simple rule of thumb, when you see a gap down in an oversold condition, start watching for a Candlestick buy signal. Which stocks should be bought when a potential reversal is in the making? There are simple scanning techniques that show which stocks are experiencing bullish participation even with the market plunging. The visual analysis of this relative strength allows investors to be prepared to enter stock positions that have good upside potential when the reversal occurs.

Trading Commodities Online, CNH Example

CNH

What type of reversal usually occurs after a severe market plunge? A very strong upsurge! Why? Because when it becomes obvious to the smart money that the markets are severely oversold, the funds that have been accumulated from selling at higher levels are waiting for  the capitulation day.

This is where huge profits can be made. Look for a gap down. If that occurs and the selling continues, go to your one minute and five-minute charts and start watching to see when the ‘churning’ begins. The candlestick signals will appear when the buyers and sellers finally find a level where they have reached equilibrium. Repeat – this is where huge profits can be made. Once the buyers see that a bottom has been made, the panic buying will start. This can produce rates of return of 20%, 40%, 100% in just a very short period of time. Watch for candlestick reversal signals or the preparation of a candlestick signals set up.

Chat room tonight – 8 PM ET- everybody is welcomeClick here for instructions. This is where scanning for the possible high profit trades becomes immensely important. The stocks that are getting obliterated because of margin calls and panic selling will be the ones that drop dramatically fast and come back up dramatically fast.

Good investing,

The Candlestick Forum Team


This Week’s Special

Trend Analysis 25% OFF at Checkout

Candlestick Precision

Subscriber Special – Only 10 sets remaining
Trading with the Confidence of Candlesticks

Click here for details.

Website special reflects current newsletter. If you are reading an archived newsletter you will be directed to Current Website Special.

Commodity Price Trends

The ability to predict commodity price trends has made a number of traders rich. There are two ways to predict commodity price trends; they are by fundamental and technical analysis of the commodities involved. Analysis and prediction of longer term commodity trends requires a basic knowledge of each commodity traded and attention to the details that affect commodity prices. It comes down to long term trading supply and demand. Technical analysis for short term trading of commodities relies upon the fact that commodity price patterns repeat themselves. It is the nature of any equity market to come to a consensus with time. However, in doing so, the path is seldom straight. Commodities markets fluctuate up and down in establishing commodity price trends. Commodity prices also fluctuate in predictable ways before a market reversal. Learning to trade both long term and short term factors is a key to commodity trading success. Starting with Commodity and Futures Training the beginning trader will establish the basis for years of successful commodities trading.

It has been hundreds of years since rice traders in Japan as well as tulip bulb traders in Holland started making sense of commodity price trends. Traders kept records of price patterns and did the first types of trend analysis. They were able to understand that before entering into a price trend a commodity would go through a number of price patterns that were repetitive and highly predictive. Candlestick analysis of Candlestick pattern formations led to successful Candlestick trading tactics that made traders rich in the days of the Samurai. These technical analysis tools are still used and still effective today in predicting commodity price trends as well as breakouts from trends. Traders need to understand market fundamentals in order to understand the potential range in which a commodity will trade and its likely eventual price. The trader who is trading oil futures , corn futures, gold futures, or virtually any futures will need to understand a different set of fundamentals but the mechanics of the commodities markets and how traders trade are the same in each of these arenas. Learning the basics of technical trading, Candlestick basics, will allow the trader to stay a step ahead by letting the market say what the market will do.

During commodity price trends the prices of commodities or commodities futures will not move up or down in a straight line. Those mostly interested in long term investing in a given commodity will typically buy or sells futures contracts based upon their analysis of the price trend. They will wait until the trend plays itself out or the contract is ready to expire before exiting the trader. A day trader with a shorter term focus will typically buy and sell futures contracts during the course of the trends, using trend analysis to guide their purchases and sales.

By following commodity price trends traders can profit from both their fundamental analysis of commodity supply and demand aspects and from their technical commodity analysis of shorter term market moves within the prevalent trend.


Market Direction

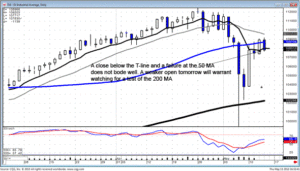
Candlestick signals make for a very simple if/then analysis. The Dow came up to the 50 day moving average last week and formed a couple Doji’s. This produced a simple analysis. We know the trend will move in the direction of how they open prices after a Doji. Friday required a positive open to indicate the bullish trend was still in progress. This would also have indicated the 50 day moving average would not be acting as resistance. However, the pre-market futures on Friday morning showed weakness in the markets. A weak open provided a new set of information. The 50 day moving average was continuing to act as resistance. The down-trending channel was still in progress. Stochastics in the overbought condition, starting to roll over, was additional confirmation the uptrend was failing and it was time to go short.

DOW

Having the visual analytical tools to apply, along with the candlestick signal, makes trend analysis very easy. The lower open on Friday made was an immediate instigation to close out any long positions that were looking weak and establishing short positions/short funds. Knowing what the trend would probably do upon a lower open allowed for closing positions immediately. This eliminates the emotional questioning most investors get involved with when they do not take action on a position at the appropriate time. It is not uncommon for a price to open lower and then continue lower with an investor thinking, “why did I not close that on the open like I should have?” The next thought process is waiting to see if there is going to be another bounce up so the position can be closed out at a better price. That thought process continues as the price keeps going lower. Or the price does bounce back up and the thought process now becomes to hold the position because it may be going back up. Candlestick signals have specific results based upon how they open and move. Knowing what should be done at the appropriate time allows for much more decisive and profitable trading.

BAC

Private training sessions – “Why would I need to do a private training session if I have already done the basic training and the boot camp?” This is a very good question! A private training session has different dynamics than an online webinar or a live seminar with 20 or 30 people. The questions you have in your mind are probably not going to be asked under those conditions. That means any additional information you receive from the point where you are unsure of something does not have a concrete effect of learning the trading process. You will not see charts that are any different during the private training session then you would during an online training webinar. However, what ever aspect of the chart analysis that was not fully clear in your mind will be addressed until you understand it completely. When you finish a private session training, you will understand candlestick analysis completely. That creates a completely different perspective for future trading. You now can go forward knowing that you have learned and understood candlestick analysis to the fullest extent. From that point, you will not be making trade decisions with the idea you are still learning and gaining experience, you will be investing based upon knowing all the aspects found in candlestick signals and trying to improve upon them.

You will gain a different perspective when all your questions about investing become fully clarified. You can now move forward with the idea that you want to improve the trading system to fit your investment style andn nature. Learning how to invest correctly is not merely reading books and watching chart analysis. Profitable investing involves knowing in your own mind that you have all the knowledge about a trading system. From there, each investor can produce the trading strategy with confidence, the confidence required to execute trades at the appropriate times without second-guessing. If you have a good understanding of candlestick signals and they’re confirming indicators, but you are still not making the big profits you have expected, you need to dig into your own psyche and discover what is holding you back. The Candlestick Forums Private Training Sessions are designed to obtain the full comprehension of the common sense aspects of candlestick analysis.

Click here for private training session information.
Chat session tonight 8 PM ET
Good Investing,
The Candlestick Forum Team


Private Training Sessions with Stephen Bigalow

now scheduling for August 27, 28, and 29 in New York

Current Website Specials

Click here for details

Website special reflects current newsletter. If you are reading an archived newsletter you will be directed to Current Website Special.