Best Trading Practices

Profitable stock trading over the long term does not come from luck. It does not come from stock tips. Profitable stock trading is the result of applying the best trading practices to stock trading. Profits come from using the best trading practices day in and day out for weeks, months, and years. Best trading practices include technical analysis of stocks with profitable trading tools like Candlestick analysis as well routine fundamental analysis to identify a stock’s margin of safety and intrinsic stock value. Best trading practices may vary from stock trader to stock trader, depending upon whether the trader is seeking profits in options trading, scalping profits from movements in stock price, or employing other trading strategies. No matter what strategy and tactics traders choose to employ, best trading practices will include the routine review of trading results in order to identify what works and what does not. Profit comes from a sound trading strategy and greater profit comes from a continuously improved trading strategy.

Because stock price patterns repeat themselves the alert trader using technical analysis tools like Candlestick pattern formations can profitably anticipate changes in stock prices. The underlying reasons for why stock price patterns develop vary according to market conditions. Part of a pattern will be due to stock fundamentals and part will be due to market reaction. The technical trader will always be wise to be aware of the fundamentals driving a stock price. However, his best trading practices will typically revolve around trading according to technical analysis of Candlestick patterns. These easy to recognize stock trading signals have been around for centuries, having evolved in commodities trading of rice in ancient Japan. These representations of stock price patterns are excellent predictors of market trends as well as market reversal.

They are equally useful in trading futurescommodities, stocks, options, and Forex.

Although there are best trading practices applicable to direct stock tradingoptions trading, or futures trading there are also best trading practices principles that apply to changing tactics as market conditions vary. For example, a trader may find profits in scalping in a market that is in an upswing but has a fair amount of stock volatility. However, if the volatility becomes extreme the trader may switch to options trading in order to reduce investment risk while still using Candlestick chart analysis to predict price movement and gain profits. Using strategies such as a long straddle the trader can buy both a call and a put on the same stock with the same options expiration date. In such a way he will profit if the stock goes up or down and will limit his risk to the price of there premiums paid.

A trader’s best trading practices will be those that work the best for him. Taking time to learn about individual stocks or about new stock trading tactics is a basic necessity for successful trading. Learning how to trade individual stocks while still maintaining a broader view of the stock market is one of the best trading practices as it will continually help the trader find the next profitable trading opportunity even as he is executing trades on the current one. Because none of us is perfect we all make mistakes. It is through the review of trading results that traders learn and continually improve trading profits.


Market Direction

Understanding the underlying forces that are involved with the creation of candlestick reversal signals becomes an extremely important factor for analyzing a market trend. The signals demonstrate the bias of investor sentiment. Utilizing this information allows for a much more comfortable trading process for the candlestick investor. There will always be times when prices appear to be going against what the predominant signal has revealed. Stepping back and analyzing which signal is still the predominant signal will allow an investor to make entry and exit decisions more accurately. A price trend is not always going to go in one direction without some waffling. Understanding which signal is still the predominant signal keeps an investor from exiting a trade too early.

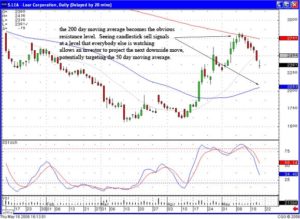
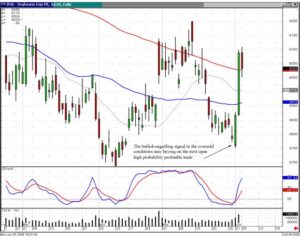
The April Live Cattle chart demonstrates how respecting the latest candlestick signal can keep an investor from exiting a trade too early. The Evening Star/Bearish Engulfing signal, that closed below the T-line, was considered the predominant signal. Monday’s trading would have been very uncomfortable for the short positions that had shorted based upon the candlestick sell signal. As can be seen, the following three days after the big sell signal, investor sentiment was indecisive. However, there was nothing that indicated the sell signal was still not the predominant analytical factor. Today’s trading saw bullish trading early in the day. Unless today’s trading finished very strong, nothing yet had changed the message conveyed from the large sell signal. The Evening Star signal would have been negated had today’s trading closed more than halfway up the large bearish candle.

Live Cattle, Best Trading Practices

Live Cattle April

Before the end of the day, the buying disappeared and the sellers came back. This obviously continued the downtrend. Suspecting the downtrend was not over at least allowed an investor to decide that if they covered their short positions, they should be prepared to reestablish the position if the selling became evident again. There are a number of simple common sense nuances associated with candlestick analysis that can greatly improve how an investor interprets a price trend.

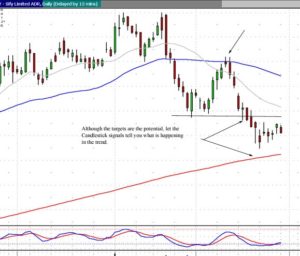
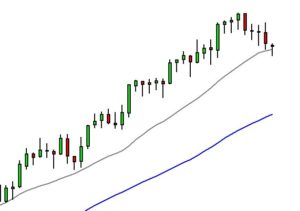
The Dow made a strong showing today, closing above the T-line. Visually analyze the Dow as a possible J-hook type pattern. This provides evidence the uptrend may still be in progress for a few more weeks. The NASDAQ is showing the same strength, but on different days. The combination of the two indexes provide a good indication to be relatively bullish in the portfolio. Where many analysts are advising to be cautious, thus limiting the potential gains of a bullish trend, candlestick analysis more clearly reveals the direction of the market. This allows for establishing positions in the portfolio with more confidence.

Dow, Best Trading Practices

DOW

There are many aspects to candlestick analysis that diminish the emotions involved with trading. Once an individual understands the benefits of candlestick signals information, they can trade with more confidence and react less to outside factors that play more upon investors emotions than they do the reality of price moves.

Chat session tonight at 8 PM ET.

Good Investing,
The Candlestick Forum Team


Current Website Special

Candlestick Profits – Eliminating Emotions With Candlestick Analysis

Make Money Investing in Stock Utilizing Candlestick Signals

How do most people attempt to make money investing in stock? Buying a recommendation from somebody else and “hoping” that they make money. Unfortunately, to make money investing in stock requires a much more systematic program. Candlestick analysis provides that format. Japanese Rice traders, over the past few centuries, learned to identify patterns on charts that revealed a high probability of a reversal occurring. To make money investing in stock, an investor requires a trading plan that has validity.

Most investors try to make money investing in stock by using whatever popular investment program seems to be working at the time. The downfall of this approach is that when a program or trading method does not work, instead of trying to understand why, most investors move on to find the next trading program that seems to be working.

Utilizing candlestick signals, while trying to make money investing in stock is one important common sense aspect. Investor psychology is built into the candlestick signals. Understanding the investor psychology allows an investor to fine-tune a high probability trading method. Being that candlestick signals is the oldest and most proven trading method in the world, the assumption can be that it works. If it doesn’t seem to be working for you, then going back and analyzing what was wrong with your interpretation leads to better education of the trading program. This constant education builds knowledge that can be utilized for any trading market in the future.

Where do candlestick signals work most effectively? Candlestick signals work effectively on their own. However, the more confirming indicators an investor can apply to the analysis of a trend, the higher the probability of being in a correct trade. A candlestick buy signal, in an oversold condition, indicates a high probability that an uptrend is going to start. A candlestick buy signal in an oversold condition and forming at a major support level such as a moving average or a trend line gives that signal that much more credibility. Conversely, a candlestick sell signal in overbought condition forming right at a major moving average is a strong indication that a downtrend is going to occur. This is not rocket science! This is having the ability to analyze, through candlestick signals, what investor sentiment is doing at important support or resistance levels.

As illustrated in the Lear Corp. chart, Doji’s forming at the 200 day moving average reveal that the uptrend is becoming indecisive at a major resistance level. If a trend fails a major resistance area such as a moving average, what becomes the next target? The next moving average below. Notice that a short position established as weakness appeared just below the 200 day moving average has already produced a relatively good profit. However, analyzing the stochastics and not seeing any candlestick buy signals should create the evaluation of the downtrend still in place, the 50 day moving average being a logical target.

LEA Stock Investing Example

LEA

The same scenario is illustrated in the SIFY chart. The Doji shows indecision at the 50 day moving average. When a moving average is failed, two levels became the obvious targets. The recent low at approximately the $11 area was the first target. If that level was breached, 200 day moving average becomes the next target. This is a common chart pattern.

SIFY Stock Investing Example

SIFY

This pattern is named the Blue Ice Failure by David Elliott of WallStreetteachers.com.

Stock Trading Software – What Are The Advantages?

If you are interested in learning about stock trading software and its realistic advantages, the following information should be helpful.

Stock Trading Software – How does it Work?

Before choosing any stock trading software, you should have moved beyond the level of beginner stock market investing. At that point, you will be able to define your rules, or criteria, for the stock trading software. The software will then scan and find stocks that match your criteria. Buy or sell signals are made evident by the software.
Once the trading signals are recognized, orders are executed. You can program the stock market investing software to place orders or they can be done manually, depending on how you’ve programmed the software.

So, the process is:

  • Rules or criteria are written for the software
  • The stock trading software matches up stocks to your criteria and makes trading signals for buying or selling.
  • The execution of orders is done.

As stated before, it is important that you have enough trading experience in the stock market and you are familiar with basic stock investing concepts. This means that you probably shouldn’t begin using stock trading software until you have a good understanding of technical analysis and enough experience with stock trading to create profitable criteria for scanning and finding stocks.

A question you may be asking is: Why do I need the software if I have enough experience?

There are several advantages of using stock trading software.

  • Manage your portfolio – You can control your investment risk reward ratios and monitor your stocks effectively.
  • Avoid greed and fear – The improper management of emotions is one of the most important reasons why investors lose money. Even though investors are aware of this and try to avoid decision-making based on their emotions, they always seem to fall into this trap again and again. Using software you help you control your emotions.
  • Time savings – Because there are so many stocks for investing, software tools scan many stocks in a short time period for investment opportunities based on your best stock market investing strategy.

Using Stock Trading Software

  • Choose software that is a good fit for your goals. There are various kinds of software on the market with differing price points for picking stocks. Find on that is suitable for your needs. There are both semi-automatic and fully automatic trading software packages available. When using semi-automatic software, you yourself place the orders. Fully automatic software can be programmed to sell and buy stocks automatically if that is your desire.
  • Short term investors consider trading software a necessity. Software is indispensable for option traders, swing traders, and stock market day trading. In general, software is suitable for short term investors. It may not be as much a necessity for long term investors.

Before you buy any stock trading software, choose one with a 100% money-back guarantee.

Trading Assistants – A Little Help From Your Friends

Sometimes, we can use some help from our friends. When stock trading, this help can really be appreciated and it comes from a firm’s trading assistants. Assigned to help the stock brokers, trading assistants perform a number of important tasks and can be the face of the firm for many stock and futures brokers.

Trading assistants are responsible for much of the day-to-day operations of brokerages and they perform numerous tasks with a wide range of responsibilities. Many of these tasks involve recording data pertaining to securities transactions. Trading assistants may contact customers, take orders, and provide limited help with investing to clients. Some of these responsibilities only require a high school diploma, while others are considered entry-level positions requiring a bachelor’s degree. Trading assistants often work in the operations departments of securities firms, on the stock market trading floors, and in branch offices. Trading assistants are also known as margin clerks, dividend clerks and transfer clerks.

Sometimes called a sales assistant, this is the most common type of clerical worker in a brokerage firm. These workers are usually assigned to two brokers. They will take calls from clients, input order tickets, open and close accounts, record client purchases and sales, and inform clients of changes to their accounts. Trading assistants must understand various investment options so that they can communicate clearly with clients. Those with a “Series 7” license can offer stock market tips to clients at the instruction of the broker. Possessing this license allows them to provide advice on securities to the public.

Trading assistants in the operations areas of securities firms may have many more duties relating to stocks, bonds, and commodities trading. Trading assistants produce the necessary records of all transactions that take place in their area of the business. Job titles for them can vary depending on the type of work they do:

  • Purchase-and-sale clerks – These trading assistants match stock orders to buy with orders to sell
  • Dividend clerks – These trading assistants ensure timely payments of cash or stock dividends to clients of a particular brokerage firm.
  • Transfer clerks – This is a group of trading assistants that execute customer requests for changes to security registration and examine stock certificates to make sure that they adhere basic stock information.
  • Receive-and-deliver clerks – This type of trading assistant facilitate the receipt and delivery of securities to fulfill stock orders.
  • Margin clerks – These assistants record and monitor activity in customers’ accounts.

Changing The Nature of Business

Computer technology has been influential in changing the nature of many of these jobs. A significant and growing number of brokerage clerks use stock market investing software to process transactions more quickly.  In most cases, only a few customized accounts are still handled manually.  In addition, the rapid expansion of online stock market trading greatly reduces the amount of paperwork because brokerage clerks are able to make trades electronically.

An Important Position

Whether helping commodity brokers or stock brokers, trading assistants hold many important positions.  Whether they are directly assisting clients or learning the profession from the brokers that they will one day join in trading and investing, trading assistants are valuable and important parts of any successful brokerage firm.  Many times possessing college degrees and being a visible part of the firm’s contact with investors, trading assistants provide a valuable service to both the brokers and the customers alike.  Sometimes we need a little help from our friends and in the brokerage houses that help many times comes from those who work as trading assistants.

Trading Tactics

Trading tactics can make the difference between success and failure in trading stocks, commodities and Forex. Whether you are trading directly or trading options or futures, good trading tactics can increase your profit and bad trading tactics can lead to substantial losses. Simple and effective trading tactics include always setting your trading stops when you are trading online. Likewise for short term trading and short term investing using trading limits is wise. Always work to understand the basic fundamentals of each stock or commodity in which you invest or trade. Much of fundamental analysis gets incorporated into stock price and commodity price as soon as it is known so we might think fundamentals are not important. However, knowing the fundamentals of a stock gives us a clear idea of the limits of stock price for it is, in the end, the fundamentals that govern stock prices. Always, always, always follow price patterns with technical analysis tools such as Candlestick pattern formations.

Because Candlestick analysis signals are clear and easy to read they tend to reduce the possibility of misunderstanding. This is, unfortunately, too often the case with how technical analysis results are displayed. The results and predictions with other technical analysis tools may well be the same as those of Candlestick analysis. However, Candlestick analysis distills all of the information into easy to read Candlestick signals allowing traders to proceed to the business of stock trading or commodity trading while others are still puzzling over just what their online trading software is trying to tell them.

General trading tactics include buying on the rumor and selling on the news. A more accurate description of how this works is that the trader sees an emerging pattern in his Candlestick stock charts. He may have been alerted to this stock by reading the stock market news. But, it is by careful examination of stock prices and their patterns that the trader using Candlesticks sets up his trade. He will buy stock, sell stock, sell short, or buy or execute options contracts when the time is right according to Candlestick chart analysis. He will then check the stock market news to confirm that a piece of news has hit the streets causing everyone else to enter the trade, often too late for good profits.

When you are in a losing position, don’t keeping adding money to the trade. This is better put in a very old saying, “Don’t throw good money after bad.” This is a matter of discipline. Trading is not gambling. We use solid tools such as Candlestick patterns in order to guide our investing and trading decisions. Letting the psychology of trading take over in a moment of difficulty is letting the twin demons of greed and fear run the show. They virtually never make you a profit and can often leave you bankrupt! The best of trading tactics is to follow your Candlestick signals, trust them, and act on them.

In regard to acting on Candlestick chart analysis there are times when not to trade. The beauty of Candlestick signals is in their clarity. Trying to force trades is one of the bad trading tactics that deplete your margin account. Sometimes the best of trading tactics is not to trade at all. Satchel Page, the famous 20th century baseball pitcher once said that if he just held on to the ball the batter could not hit it. Likewise, not forcing bad trades keeps the market demons away and saves you money. Use your Candlesticks, trust them, and when they say not to trade, don’t!

Market Direction

Was there a way to take advantage of the big gap-down selling today? Not really! The nature of the market trading for the past few weeks has been very schizophrenic, up big one day and down big two days later. Both the Dow and the NASDAQ opened to the downside very quickly today. Most stocks gapped down, not giving the opportunity to short them. Was candlestick analysis a benefit to investors in predicting a gap down? No, but candlestick analysis should have had the portfolio positioned correctly.

For the past two weeks, the wild fluctuations in the markets have revealed the Bulls and the Bears did not have control of the market direction. When there is no evidence of a viable trend, this has obvious consequences for an investor. The major benefit of candlestick analysis is that it allows an investor to evaluate a direction of a price/trend with reasonably accurate results. The purpose of investing is to put funds to work with the probabilities being in your favor. When the market conditions demonstrate there is no beneficial probabilities, the investor has investment decisions that can be made from that information.

Trading Tactics, Dow

DOW

Trading Tactics, NASDAQ

NASDAQ

As the Dow chart and the NASDAQ chart reveals, a sideways trend channel had been in progress for the past two or three weeks. These conditions did not produce any favorable probabilities for either to be long or short. In most cases, the proper investment strategy would have been to sit on the sidelines until a trend direction could be detected. This is the logical strategy for the majority of traders. However, candlestick analysis provides one more opportunity. It allows an investor to pinpoint the few stocks that are showing good strength and the few stocks that are showing great weakness. This allows for a portfolio mixed with long and short positions that will benefit from the sideways market.

There will always be opportunities to make money in all market conditions. The simplicity of candlestick scans allows for identifying the positions that are moving, even with the market in a relatively flat mode. Take advantage of the information built into the signals and patterns. This information will allow for highly accurate trend of valuation and the ability to make profits when others are sitting on the sidelines. Candlestick analysis provides a trading platform consisting of reoccurring price movements based upon investor sentiment.

Understanding the psychology that is built into the signals is a major factor for understanding why prices move as they do. Recognizing pattern setups allows an investor to take advantage of big price moves prior to their movement. As illustrated in the TCK chart, the slow curve showing failure at the T-line was an indication the bears were starting to take control. These are trading areas that can be executed prior to a major move to the downside. The inherent pressures of price movements makes it feasible to take advantage of prices going in the direction of the market indexes while also being positioned in trades that were anticipating the opposite direction. Those trades, although producing small losses when the market moves big in one direction, would be much more than offset by the positions that were oriented toward the actual market move.

Trading Tactics, TCK

TCK

Trading Tactics, EW

EW
 
Chat session tonight at 8 PM ET.

The new book – Candlestick Profits, Eliminating Emotions with Candlestick Analysis, is in delivery from the printers. They should be in Houston on Tuesday, March 15. If you have not yet ordered your book, please do so this week. Once the books are sent out, you will have lost the opportunity of finding that crisp $100 Bill to be placed in one of the premarket release books. Hurry to order the new book Candlestick Profits – Eliminating Emotions with Candlestick Analysis before the special end!

Good Investing,
The Candlestick Forum Team

Commodity Swing Trading Made Easy with Candlestick Signals

Commodity swing trading is usually considered high risk investing. That is not necessarily so when utilizing candlestick signals. A major advantage that commodity swing trading has over stock swing trading is the consistency of a trend move. Commodity trends usually work in a more consistent fashion. The reason is very simple. There are less outside influences on a commodity price than there is on a stock price. Most commodities are affected by merely supply and demand. This makes commodity swing trading a little easier to implement than stock trading. Whereas a swing trade in stocks may be a 2 to 10 day trading period, commodity swing trading might experience holds of 5 to 20 trading days.

Stock prices have many more influences with which to contend. The market move in general, interest rates, crude oil prices, the US dollar, and a multitude of other influences that may change the trend of a stock price. Candlestick reversal signals provide excellent points to be buying in stocks. The reversal signals work that much better with commodity prices. Commodity swing trading gains the benefit of seeing where a reversal will occur and then knowing the new trend should provide a steady move from that reversal.

Keep in mind, Japanese candlesticks signals were developed with the most basic of commodities, Rice. Learning how to utilize the 12 major candlestick signals is the first step for putting investment funds into high probability trades. Commodity swing trading has the advantage of steady price moves as well as price patterns. The same patterns that are utilized in stock trading, such as the Jay-hook pattern, the scoop pattern, the cradle pattern, etc. work equally well with commodities. Learn the 12 major signals and you will understand where the high probability buy and sell points will be. Once you have become familiar with the signals, then move on to learning price patterns. Price patterns while incorporating candlestick signals dramatically improve the probabilities of being in high profit trades. Click here for the 12 major signals training CD special.

The profits that can be produced in commodity swing trading are extremely large. The risk of trading high leveraged trading entities becomes minimized when knowing what the candlestick signals are revealing. They produce a confidence to buy at the bottom and sell at the top. They also clearly demonstrate where a stop loss points should be placed. Having this knowledge allows an investor to take advantage of any trading market. Participating in the right direction at the right time is very critical in commodity swing trading. As illustrated in the soybean buy signal, the Bullish Engulfing signal, late last week created the opportunity to be in to a very profitable trade.

Commodity Swing Trading, Soybeans

July Soybeans

Market Direction

Both the Dow and the NASDAQ failed their major moving averages. The Dow was going to come back up and tests the 50-day moving average once more but showed a Doji on Friday followed by strong selling on Monday. The first indication early last week of coming down to test the 200-day moving average is now back in the a valuation. This coincided with a failure of the NASDAQ at the 200 day moving average. Both now have their stochastics turning back down. Keep in mind; this is the evaluation of investor sentiment at important technical levels. As of now, all indications are that prices are going to move down to the next important technical levels.

Commodity Swing Trading, Soybeans

DOW

Commodity Trading Signals

Learning commodity trading signals will open the door to profits in trading commodity futures. Commodity and Futures Training using Candlestick chart patterns allows traders to learn what Japanese rice traders knew centuries ago. The market can tell you what the market will do if you learn how to read the commodity trading signals. There are a dozen Candlestick patterns that traders should commit to memory and another 28 that can reliably predict market behavior. Candlestick charting techniques have a long and successful history of predicting commodity market movement. Candlestick trading tactics are like most tactics derived from technical analysisCandlestick basics predict market activity and the trader either buys or sells commodities based on the insight derived.
Successful commodities traders start with a solid foundation of fundamental analysis of the commodity or commodities that they trade. There are reasonable limits to prices on a commodities exchange. Knowing where these limits are will help guide successful commodities trading. Within the extremes technical analysis tools can give solid commodity trading signals. Major Candlestick signals include the Doji, Bullish Engulfing, and Bearish Engulfing signals. Candlestick chart analysis can also be done with time honored commodity trading signals such as the Tri Star Pattern, the Three Black Crows, the Three Identical Crows, and the Two Crows patterns. All of these are secondary patterns typically indicating market reversals. A Commodity and Futures Training class will help the beginner learn both the fundamental and technical aspects of the commodities markets.

Commodity trading signals can be useful to both the companies buying commodities or the producers in hedging investment risk. Trading signals may be more useful to traders who routinely buy and sell commodities or who trade options on commodity futures. Although those hedging risk in the commodities markets may buy and sell once or twice a year the trader can and will watch the market throughout the year and throughout the day looking for commodity trading signals that will lead to profit. The addition of traders speculating on commodity prices adds volume and liquidity to the market leading to more traders trading and increasing volume. It is with high trading volume and liquidity that commodity trading signals work the best and are most profitable when followed.

Technical trading works best when applied through a trading strategy. The trader will learn with time which trading signals can be used to make the most profit. With experience the trader can learn more and more efficient execution of the trading strategy. The trader will learn which commodities he or she trades most effectively and which trading signals derived from Candlestick charts are most predictive of market changes for the commodity in question. With competent instruction the trader can learn effective use trading signals coupled with the use of techniques such as Candlestick trading tactics to make consistent profits. At the same time proper reading of market signals will help reduce risk while enhancing return on investment. For those interested in trading options on commodity futures a good choice is to take options training with Stephen Bigalow.


Market Direction

Investor sentiment is the force that moves prices/markets. Candlestick signals reveal the nature of investor sentiment. The signals work extremely well on their own. However, an investor can glean an immense amount of information utilizing candlestick signals and the other obvious information a chart is revealing. Today, the markets experienced a severe selloff on the open. This made for further confirmation of the possible reversal in the trend if you include the Evening Star signal that formed in the Dow last week. How does one know whether it is time to close out long positions when the market opens lower like it did today? They don’t! But they have to take a look at what was affecting the trend to this point. The tee line has acted as support for this uptrend for the past two months. That fact has to be put into the evaluation.

The longer a trend remains in existence, the more severe the reversal signal needs to be. Recently the markets have been reacting to positive or negative earnings reports on a daily basis. The overall trend has remained consistently above the tee line. The severe selling on today’s open was scary. However, up to this point, the trend had been fairly solid. It is prudent to not react until the daily signal confirms there has been a change of investor sentiment. As was witnessed today, the buying came back into the markets after about one hour of languishing near the lows. The intraday charts should have been utilized to see what the trend was doing. If the five-minute chart demonstrated a lengthy flat trading range, there is extreme hurry to close out the positions. They are probably already trading off after the selloff. If the markets appeared as if they were going to close at the low end of the trading range by the end of the day, then you could be selling those positions, probably at approximately the same level as were they were trading one hour after the open.

Commodity Trading, Dow Example

DOW

If the Bulls step back in, as they have done for the last two months, and close the markets above the tee line, a very simple assumption can be made. The uptrend is in progress as long as they cannot close it below the tee line.
Waiting to see what investor sentiment is doing after any price opens becomes a very prudent entry and exit strategy. As seen in the TLEO chart, it opened positive. It also started selling off immediately from that level. What should be witnessed after a candlestick buy signal? Continued buying! In the case of TLEO, there is nothing wrong with waiting one or two minutes to see if the buyers are still participating after the price opens positive following day candlestick buy signal.

TLEO, commodity trading

TLEO

@How the markets closed today would be very important for indicating what was occurring an investor sentiment. Obviously a close at the lower end of today’s trading range would reveal the tee line had not acted as support. You do not have to buy at the absolute bottom or sell at the absolute top. Your entry and exit strategies should include practices that improve the probabilities for profiting from that trade.

No Chat Session Tonight due to Traveling

Good Investing,
The Candlestick Forum Team


Hot Penny Stocks

Hot penny stocks are those stocks that trade from .001 of a penny to $5.00. They are extremely risky yet they have remarkable reward potential. Penny stocks are referred to as over the counter stocks because they are listed on the Over the Counter Bulletin Board.

To qualify as a penny stock, the stock must meet four criteria.

  1. The stock must be priced below five dollars.
  2. The stock is not traded on a national stock exchange or on the NASDAQ.
  3. The stock may be listed on the “pink sheets” the NASD or the OTC Bulletin Board as explained above.
  4. Lastly, the company that issues the stock must have less that $5 million in tangible assets and must only have been in business less than three years.

Many investors buy penny stocks considered “hot penny stocks” because it does not take a large investment to get started. They give the average investor the opportunity to obtain a significant number of shares without having to invest a large chunk of their hard earned money. In other words it provides the successful trader the ability to turn a relatively small investment into a large fortune. This is precisely why hot penny stocks are so popular. The downside of course is that the volatility of shares and the lack of corporate transparency that can quickly make a penny stocks worthless.

It is important to note that the true value of a company and the price of their hot penny stocks are not always necessarily indicative of each other. In fact, most penny stocks are at the developmental stages and have been overlooked by the investment community for reasons unknown. While this has given penny stock investing a bad reputation, there are those penny stocks that truly represent a legitimate investment opportunity. Those are the best penny stocks that you need to find! There are actually studies that show that many companies have standards that they must meet before they are allowed to be traded OTC. The ones that you must watch out for are the companies that are unethically managed. These are the so called hot penny stocks that that are promoted and then quickly sold off to make a profit. By the time naive investors have bought them, the hype has worn off and they cannot sell them. Watch out for these schemes!


There are also those situations when companies are well established and are still considered to have hot penny stocks. These are companies that are truly trying to grow so that they go above the penny stock status and can potentially be traded on the NYSE or another major exchange. These businesses truly opt to increase their customer’s value in the stock market.

Hot penny stocks contain an element of risk just like any other type of investment. The point is that you must build your list of penny stocks very carefully. Do as much research as you can, and think twice before investing in a hyped up penny stock. There are penny stocks worth investing in, but it is up to you, the investor to find them.

Stock Price Analysis

Stock price analysis lies at the root of profitable stock trading. Stock traders profit from buying stock, selling stocktrading stock options, and trading futures on stocks. Traders profit from the price difference between entering a stock position and exiting. Thus stock price analysis is essential. Long term investing relies upon an analysis of the margin of safety of a stock and intrinsic stock value. However, buying a promising stock that has already run up in stock price can greatly diminish profits. Thus stock price analysis can be as important for the long term investor as it is for the day trader. Both long term investors and traders can profit from the use of Candlestick analysis. This easy to read technical analysis tool allows traders to execute trades with a high statistical probability of success without falling prey to the twin stock market trading demons of fear and greed.

Stock price analysis can be carried out with the long view in mind and with an eye towards minute by minute day trading profits. A conservative investor may wish to have a couple of dividend stocks in his stock portfolio. Using stock price analysis he will often buy these stocks when interest rates are high because the stock prices of dividend stocks will commonly be low at these times. When interest rates fall the investor will have the choice of continuing to receive dividends or selling the dividend stock at the now-higher stock price. On the other hand the day trader will commonly use Candlestick stock charts in order to anticipate short and medium term stock price fluctuations. Although the long term investor will commonly prefer a very stable and predictable stock the trader will commonly look for stock volatility and market volatility which picking stocks in search of short term trading profits.

It is common for successful investors to use technical analysis tools such as Candlestick patterns in choose if and when to purchase a stock. The long term investor will look for stocks with strong forward looking earnings potential as well as the margin of safety that cash in the bank and unencumbered physical assets represent. However, such stocks are often highly priced as investors are willing to pay for the promise and security that the stock offers. Thus an astute investor will often pass on such otherwise promising stock after seeing its high price to earnings ratio or high price to sales ratio. Here is where tools such as Candlestick pattern formations come to the aid of the long term investor. Even very stable and successful companies see their stock prices fluctuate during stock market crashes, rumors of mergers and acquisitions, or news of a new product coming out from a competitor. By using Candlestick signals for stock price analysis the long term investor will commonly be able to gain market insight during times of high price volatility and successfully purchase the stock in question on a short term correction. Whether one is interested in long term investing or trading for short term profits, stock price analysis with Japanese Candlesticks gives one a high statistical probability of success without the confusion and mistakes that the psychology of trading can bring about.


Market Direction

Has the downtrend reversed? Has the candlestick signals revealed reversal signals? Although the markets are still in a slow down trend, there have been candlestick reversal signals being formed at these levels. That is providing valuable information. It is visually revealing that buyers are starting to step in at these levels. There are very simple strategies that allow investors to be positioned correctly if a transition in the market trend is starting to take place. 

Private training sessions – August 2011 – It is often asked what are the benefits of attending a private training session. There is a definite benefit to learning candlestick signals and patterns and the related factors surrounding candlesticks that produce consistent profits. These private training sessions, consisting of three or four traders being instructed by Stephen W Bigalow allow for very concise demonstrations and answers to one’s personal questions. Have you ever gone through a training session where your questions were quite answered to where you fully understood? And then the remaining portion of the training session was a little bit hazy because you weren’t fully understanding a specific aspect? A private training session consists of two solid days of viewing and understanding how candlestick analysis works effectively. You will not be provided with information that you have to figure out how to use correctly. You will be instructed in how to use candlestick signals correctly. You do not believe the training with any un-answered questions in your mind.

When you see how candlestick analysis is derived from common sense investment practices, your concept on how to invest correctly is completely altered. You will understand how to buy at the bottoms when everybody else is selling and selling at the tops when everybody else is buying. You will learn how to scan for the high probability/high profit trades. You will learn how to automatically set your stop loss procedures without having any emotional attachment. The learning process is not a “drum into your head” memorization process. Stephen Bigalow shows you how to interpret high profit trading patterns as a natural visual perspective. What makes it even better is the learning environment. The teaching process is done on a porch reviewing charts while also enjoying the clear waters of Keuka Lake, a beautiful Finger Lake of New York State. Breaks do not consist of getting a drink at the water fountain in the hallway of a stark hotel. Breaks at these training sessions consist of taking a dip in the cool and refreshing waters of the lake. The learning process does not end away from the computer screens. Investors can continue to ask questions and get answers from Mr. Bigalow at some of the best wineries in the nation or at dinner in a historic hotel restaurant overlooking the lake.

When you finish a candlestick training session, you will have gained a completely different perspective on what makes consistent profits in the markets. You become a controller of your investments versus the markets controlling you. Do not miss this opportunity to gain valuable insights into the most proven investment program in the world. The nuances of 400 years of candlestick observations, when conveyed to you in very pleasant surroundings, allows you to go home and make consistent returns. These training sessions are an excellent getaway for bringing your spouse and having them enjoy the attractions of the New York’s Finger Lakes region. Seats are obviously very limited. We will have this item posted in our site on Friday.

Chat session tonight at 8 PM ETEveryone Is Welcome.

Good Investing,

The Candlestick Forum Team

Scanning For Trades That Produce Higher Profits

Traders can spend too much time scanning for trades. It almost sounds paradoxical; an investor needs good trades to be profitable, but spending hours in vain searching for the “needle in the haystack” typically produces nothing but another bad trade. It is actually quite easy to pick stocks. Who hasn’t looked back and said something like, “I knew to buy Microsoft when it was $2.00 a share.”? The pick is easy; for most, taking a position is the hardest part. While it is easy to sit back and hope for stock market tips, a proactive investor will combine a stock trading plan with a proven stock trading software to form a channel for locating and buying good stocks.

A stock trading system is fundamental to every trade and something that the investor establishes prior to moving in the stock market. A stock trading system, such as candlestick analysis stock market investing is the method of interpreting movements in the stock market. Scanning for trades using stock scanning software is the final critical piece needed to help the investor to make his or her own trading tips.

There are many software programs available for scanning for trades. It is important to find one that offers the desired features and results without excessive processing time or confusing programming requirements. Simple online searches or the best investment advice from satisfied friends can be the most successful ways to locate a software package. The important thing to remember with any stock market investing software is that the purpose isn’t to locate the perfect trade. Scanning for trades with software only provides the data needed to perform stock technical analysis. This will allow the investor to use his or her stock investing system to provide the tips needed to make a trade. The best trading tip available is for the investor to use his or her own eyes. A good formula is to use while scanning for trades is to identify a crude group of prospects, then for the trader to review the list for prospects. After this is complete, an analysis of the chart formations becomes much easier to complete since the data is inclusive.
An excellent trading tip is to make the stock scanning software become part of the process for identifying potential trades, not the final authority. When using candlestick trading tactics, a trader can then evaluate the candlestick chart formations and determine a course of action. Chart formations indicate the direction a stock is moving and any unusual directions it might encounter in the process.

The “needle in the haystack” is the thing that every investor wants to find. With a stock trading plan, a stock investing system and stock trading software, scanning for trades becomes easier than ever to find that needle. The three pieces needed to identify successful trades are in place. And when the opportunity rolls around next time, the investor can stand up proudly at the Rolls Royce dealership and proclaim, ?I knew to buy stock in ABC Corp when it was only $1.00 per share!? right before driving away in that $125,000 Rolls he earned by scanning for trades the right way and putting in the effort to give himself a winning edge.


Market Direction

Candlestick signals provide a much clearer picture of what the overall market trend will be doing. The candlestick formations provide an immense amount of information. That information becomes very easy to analyze because of its visual nature. This past week, the markets showed a strong possibility that the sellers could be taking control. The big down day in both the Dow and the NASDAQ was confirmation. Was this a full scale reversal or was it profit taking? Analyzing the candle formations at important technical levels make trend analysis very easy to comprehend.

After the severe pullback in the markets, which could have led to more downside, the markets supported in an important level, the 20 day moving average. Why was this an important level? Because the uptrend of the past few months has been supporting on the 20 day moving average. The Morning Star signal over the past three days of trading in the Dow, right at the 20 day moving average, was a good indication that the Bulls were still participating in this trend.

Scanning for Trades Dow

Dow

The small bullish candle in the NASDAQ, right on the 20 day moving average, provided easy analytical criteria for how the trend should continue. With the stochastics heading in a downward direction, the small bullish candle in the NASDAQ on Wednesday would have been considered merely a bounce after a big down day had prices continued lower the following day. The lack of support at the 20 day moving average would have simply revealed that the 20 day moving average was not acting as a support level anymore.

Scanning for Trades NASDAQ

NASDAQ

The fact that there was a gap up following a bullish candle the next day produced significant information. The buyers were stepping back in with enthusiasm. This provided reasonably good information that the sellers had not yet taken control of the trend. This is not sophisticated analysis. This is merely interpreting what the candlestick signals are telling us. If the Bulls were stepping in again, maintaining the uptrend, that should provide a good number of trade opportunities.

There are thousands of stock trade opportunities. How does an investor analyze which trades are going to have the best potential and how can that be done in a reasonable amount of time? Candlestick signals are very beneficial for cultivating down to the best possible trades. Knowing what is incorporated into each signal provides scanning formulas that make finding the strongest trades very easy.

The application of common sense scanning criteria provided by candlestick analysis creates a very simple trade process. What criteria can be added to the scanning analysis that continually puts the probabilities in the investors favor? What direction is the overall trend of the market? That can be easily analyzed using candlestick signals. What direction is a specific sector moving? That can also be easily analyzed using candlestick signals. What chart patterns or signals produce the highest potential of a strong price move? When all these criteria are put into simple scanning processes, a small number of high potential trades can be identified in a matter of a few minutes each day.
Will the scanning results put you into big profit trades? Not necessarily, but what the results from a candlestick scanning technique does provide is trade setups that have the potential for being big profit trades. The Dynavax Tech chart illustrates the simple logic involved with being able to identify candlestick reversal signals and applying that information with other technical parameters.

Scanning for Trades DVAX

DVAX

The Hammer type signal forming right on the 50 day moving average, a major potential support level, with stochastics in the oversold condition, followed by a gap up in price, makes for an extremely high potential/high profit trade situation. This position was recommended in our Candlestick Forum members’ area based upon the identification of a strong buy signal. Again, will the scanning results put you into big profit trades? The scanning results produce situations for participating in  high potential trades.

Understanding the psychology in  price trends becomes very important for participating in big profit trades. That psychology can be better interpreted when identifying and evaluating what the individual candlestick formations represent. Being able to evaluate what ‘might’ be occurring during a price trend, based upon the previous candle formations, such as inordinate strength, has a different potential result than a previous moderate uptrend. Learning how to properly use candlestick analysis is very easy. It is the common sense evaluation of what has occurred in investor sentiment during a price move millions of times in the past.

NEW RELEASE – Scanning Techniques to Higher Profits is now available on the website. This training CD provides an easy step-by-step process for creating effective scanning techniques. Additionally, the analytical process is incorporated into the evaluation of the highest potential trades for the next trading day. This powerful combination allows an investor to be participating in the potential big profit moves.

Click here to receive the Introductory Price Special on – Scanning Techniques to Higher Profits 

Chat session tonight open to everybody 8 p.m. ET – Stock Chat Instructions Here

Good investing,
The Candlestick Forum Staff