Commodity Market History

Knowing commodity market history allows us to know what the commodities markets will do next. Whether you are buying stock, trading options, selling futures, or trading commodities, knowledge of market history is essential. Trading software has market history built into its programs. Thus commodity traders who are trading online can do simulation trading with real commodity market conditions. More to the point keeping track of commodity market history goes back as far as when  were new. Traders kept track of what happened when certain Candlestick chart formations developed. The use of technical analysis tools such as Candlestick charting allows traders to predict market moves using market history. A good way to learn to use technical analysis based on commodity market history to your advantage is to take commodity and futures training.

The reason traders keep track of commodity market history is that this history repeats itself. Thus patterns, such as Candlestick pattern formations, are predictive of continuing market trends or market reversal. Although a trader may be steeped in fundamental analysis of a commodity he or she still needs to be attuned to technical analysis indicators because these predict the actions of large groups of traders in live market conditions. There really is a déjà vu character to what is essentially trading using commodity market history as a guide. When true market history is packaged and schematized the trader should not forget that those neat little figures on the chart are really representations of many trading sessions in many commodities. They are predictors of how real traders, in groups, will react to market conditions and to each other to create the next state of trading in commodities.

In trading commodities you can buy and sell futures on everything from gold and copper to live cattle or interest rates. You can also trade options. The distillation of commodity market history in Candlestick chart patterns will help with selling putsselling callsbuying puts, and buying calls on commodities futures just as much as it helps trading futures directly. The presence of a sufficient number of traders in a sufficiently volatile market will end up creating patterns as traders react to fundamentals of the market as to each other’s trades. Although each trader will do fundamental commodity analysis as well as analysis of technical factors, the fact that one trade is entered at a time changes the market ever so slightly with each trade. Thus all traders minus one are confronted with a slightly different situation. As trades are executed the market changes, traders reevaluate, change tactics, and patterns develop.

The wise trader will always use trading analysis tools and be mindful of the fact that history continually repeats itself on a commodities exchange. It is this realization that every day creates market history and that history repeats itself in the form of recognizable price patterns that gives the wise trader an advantage. This is what Japanese rice traders realized centuries ago. The use of Candlestick charting techniques gave these traders an edge on those who only looked at market fundamentals.


Market Direction

Today’s whipsaw action in the market was partly due to the heavy selling that was actually occurring but then an electronic anomaly set in. Probably the lower 400 or 500 points in the Dow was a result of electronic trading. The New York Stock Exchange has the discretion of stopping trading in individual stocks that are getting overloaded for anywhere from 30 seconds to 90 seconds. However, the rest of the electronic exchanges are still active but if they are thinly traded exchanges, an electronic sell order trying to find the best bid price may hit one of these secondary markets at much lower prices.

Commodity History, Dow Example

DOW

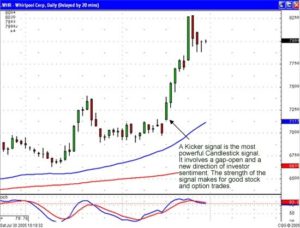
Whatever the conditions, the candlestick signals were indicating selling was on its way. The sell signals last week at the tee line indicated a definite change of investor sentiment. The whipsaw trading of last week was an indication a severe change of investor sentiment was occurring. The Dow and the NASDAQ had the possibility of supporting at the 50 day moving average today but continued weakness breach that level with great enthusiasm. As the selling continued, panic selling started to set in. Although the Dow being down 900+ points was probably not a true indication of where the markets should be trading, the 347 point move in the Dow was still relatively substantial. This was what the bearish signals revealed last week. A bearish pull back was in the making.

Obviously there would not be any feelings of anxiety you were situated correctly in the market. There is a great sense of pleasure being short when the market is heading down. It is a Double Mint pleasure. First, it feels very good to watch the profits grow as prices are going down. Secondly, it feels that much better knowing the pain of what it feels like to be long when prices are going down and you are not having to experience it. Most investors are optimists. They want the market to go up. That is only human nature. When prices are going up, everything seems to be improving. It is harder to make money when the market is moving down. A large percentage of investors do not like or understand shorting stocks. Buying the short funds seems to be a comfortable alternative.

Commodity History, BGZ

BGZ Short Fund

Candlestick analysis provides the investor with the tools they need. Candlestick signals show the direction of the market in general. That analysis can be continued to individual sectors, then on to individual stocks. This is the alignment of the stars. The information built into the candlestick signals allows investors to participate on the correct side of the market. What would have been an anguish filled day for most investors was an exuberant, highly profitable day for the candlestick investor.

Commodity traders

A two day training program is now scheduled for May 22 and May 23. You will learn numerous techniques to take advantage of what candlestick signals reveal for intraday trading and swing trading of commodities and currencies. This two day online training program will expose you to an immense amount of profitable information. Commodity trading using candlestick signals can be extremely profitable. What is considered a high risk trading venue now becomes a high profit venue. There are many advantages to trading commodities. If you are a true traitor, you can be trading stocks at the beginning and the end of each day while trading commodities during the slow middle part of the day. Spaces will be limited. Look for details on the home page over the weekend.

Chat session tonight at 8 PM ET – learn how to have made huge profits on days like today.

Good Investing,

The Candlestick Forum Team


This Week’s Special

Projecting Price Targets – Quickly learn to spot the most profitable price targets! – BONUS EBOOK with purchase!!!

Click here for details

Website special reflects current newsletter. If you are reading an archived newsletter you will be directed to Current Website Special.

Understanding Stock Market Movement

Given enough time investing in the stock market, a trader will tell you that the research and analysis require the most time. In order to be successful, an investor needs to understand how the markets move and how to interpret differences in the various market indexes and what they mean. This kind of evaluation becomes an important part of an investor’s technical analysis of the stock market. It can add further clarity to various stock market movements and help an investor to find potential trades.

Let’s start this review by looking at each of the big three market indexes:

  • S&P 500 – This market index is most commonly used by professionals in the financial world because it includes such a large sector of the market. It includes 500 of the most widely traded stocks and because it is a market cap weighted index, changes in larger companies tend to reflect more strongly than small cap stocks. The S&P 500 tends to be a more accurate indicator of market movements than the Dow.
  • The NASDAQ Stock Market Composite – Even though this market index includes all of the stocks that are listed on the NASDAQ market, it is historically weighted toward technology stocks. This condition is the result of the fact that it is a market cap weighted index and thus the large cap stocks of technology companies strongly influence this index.
  • The Dow Jones Industrial Average – This is the old-timer of the bunch. The Dow is the oldest, most widely known and most quoted of all the market indexes. The Dow tracks 30 of the most influential companies in the US and because it represents only large companies, it misses out on the small and mid-size companies completely. Unlike the S&P 500 and the NASDAQ, the Dow is a price weighted market index which means that if a stock price changes by $1, the effect on the market index is the same no matter the price of the stock. The Dow reflects only about 25% of the total market but changes in the Dow tend to reflect consumer confidence in the stock market as a whole.

What perspective does each index take?

Because each of the indexes takes a different approach, the stock market movement for each is different. For example, the NASDAQ structured so that technology stocks enjoy greater prominence that those in other stock sectors. This was evident in the late 1990’s when the technology boom was taking place. As events unfold that effect the technology sector, the NASDAQ will tend to see the most dramatic stock market movement, although the Dow will also be significantly affected.

The S&P 500, on the other hand, is not as severely impacted by tech stocks but tends to have a stock market movement that more accurately reflects the market in its entirety. Because it is weighted to the larger stocks it does not have the violent reaction to Wall Street news that its small-cap stocks might cause. The overall balance of the S&P 500 causes a more accurate representation of market movement than the Dow. This is the reason that most financial professionals use it as their barometer for stock market movement.

The Dow is the interesting one of the bunch; the granddaddy of the market indexes, it looks only to the 30 most influential stocks for its analysis of market movements. These are all large-cap stocks so they do not accurately evaluate the entire market, yet the Dow has proven to be the best market index for indicating consumer confidence.

Conclusion

No one index gives you the entire picture of stock market movements. The combination of the three can help you draw better conclusions about the market movements and what is motivating them. Activity by the tech sector will appear with strong reactions by the NASDAQ. Strong movements by the Dow can indicate whether the consumers are feeling good about the market in general. The Dow, though weighted to the top, will be a better indication of the overall stock market movement. By considering all three, successful traders can locate where highs and lows in stock market movement can be found and invest accordingly.

Stock Market Education

Successful investing in the stock market takes time and patience and most importantly requires a thorough stock market education. There are many different ways to trade stock and many valuable resources available to assist you, but without basic knowledge in the stock market, and how it works, you are far from a successful investing career.

The stock market is a private or public market for the trading of company stock and derivatives of company stock at an agreed upon price. The stocks are listed and traded on stock exchanges and the purpose of these exchanges is to facilitate the exchange of securities between buyers and sellers. There is no doubt that anyone can make money through trading and investing in the stock market, but stock market education and the right training is necessary to succeed.

When you decide to learn how to play the stock market game, you will first learn about two basic methods. These methods are referred to as technical analysis and fundamental analysis. Technical analysis studies price actions in the markets through the utilization of charts and techniques. The idea is to learn how to forecast price trends focusing only on price movements and not on the company’s financials. Fundamental analysis focuses on general economic conditions, business trends, and analysis of company filings and financial statements. Through obtaining a stock market education you will be able to determine which method you prefer so that you can trade stock efficiently. In addition to learning about fundamental and technical analysis you will also need to understand what it means to own stock. When you buy stock, you are actually paying for a small percentage of everything that the company owns. You are considered a shareholder or a stock holder and you own a small fraction of a corporation.

Your stock market education will also consist of an introduction to the various stock exchanges available for trading. The stock market in the United States includes the trading of securities that are listed on the New York Stock Exchange (NYSE), the NASDAQ, and the Amex. Only those stocks listed with each exchange may be traded and the purpose is to match buyers and sellers. The NASDAQ is completely electronic where all of the trading is completed over a computer network, unlike the NYSE that requires human contact and interaction to match buyers and sellers. You may also be introduced to the major European stock exchanges such as the Euronext, the London Stock Exchange, and the Deutsche Borse.

After obtaining a stock market education, the investor is required to establish a trading plan, method and the type of trading that they will participate in whether it is day trading or long term trading. Luckily there is something for every type of investor no matter how much money you have, and not matter how much time you have to devote to trading stock. The stock market is vital to our economy and is one of the most important sources for companies to raise money.  It allows business to go public or to raise additional capital in order to expand. Start to learn about the stock market today so that you can participate in expanding the global economy and make some money for yourself in the meantime.

Fundamental Commodity Analysis

Fundamental commodity analysis is how traders understand the big picture. It is how they maintain a sense of perspective in commodities marketsCommodity prices fluctuate in the short term based on technical trading analysis. Long term commodity trading is much more heavily based upon fundamental analysis of the commodities markets. Fundamental commodity analysis comes down to two factors, supply and demand in commodity tradingCommodities and Futures Training can be a great help in developing effective strategies for trading on a commodities exchange.

The commodity futures market is different for crops and livestock than it is for durable commodities such as gold. Commodities trading in each can be profitable but it is important for commodities traders to understand the differences in supply and demand for these two types of commodities. Here we look at crops and livestock.

Commodity supply can be influenced by a large number of factors. Supply factors are different for trading agricultural commodities as opposed to the commodity market in precious metals, for example. Food can be stored dry or refrigerated but eventually needs to be consumed. Food is, in fact, produced to be eaten. Therefore the supply of crops and livestock needs to be replenished every growing season. This makes food commodities susceptible to short term factors such as the weather in different parts of the globe. It also makes food supply dependent upon adequate storage as well as transportation from producing areas to the consumer. Fundamental commodity analysis of these factors will improve the chances of success in trading commodities.

The amount of crops planted, the amount not consumed last year, crop disease, weather, anything that stops food from arriving at the table, and technology. Low supply leads to higher commodity prices and higher prices lead to more production and higher supply. Higher supply leads to lower prices and reduced production and then the cycle repeats itself. Commodity investing will be more successful if the trader understands the factors that increase and decrease food production and availability of the commodity. The so called Green Revolution that increased crop yields not only fed millions more but it helped keep each grain commodity price within reasonable limits. An understanding of genetic engineering and crop yields is an excellent example of fundamental commodity analysis.

Fundamental commodity analysis starts with supply but supply is inextricably tied to demand. Absolutely sufficient supply related to demand would mean that commodity prices would stay absolutely fixed, year after year. Commodity trading charts would just show a flat line extending into the future. Commodity trading software would not be needed and, in fact, food would not be a trading commodity. With a growing world population and more affluent societies in Asia demanding more protein rich food the demand for livestock has gone up and grains are diverted into cattle feed instead of being sent to the table. Understanding the changing dietary patterns of much of the developing world is part of fundamental commodity analysis. Good commodities tips may have as much to do with what Chinese teenagers want to eat as with how much land is planted in Argentina, Brazil, the United States, Canada, and the Ukraine.


Market Direction

Why is it dangerous to listen to one person’s fundamental analysis? Everybody has an outlook on what should be occurring in the future. Unfortunately, when one person evaluates the likelihood of events for the future, it is based upon the information made available to them. It also involves factors in their thinking process. That process may over emphasize or under emphasize elements that could affect the movement of future prices. Where one analyst may view information in a positive perspective, another analyst they look at the same information with a negative perspective. This makes relying upon one person’s analytical view as a very high risk investment strategy. Even Warren Buffett has had huge losses in specific sectors or currencies in the past.

What makes for a successful analytical view? The overall market! The best way to take advantage of everybody’s fundamental analysis is analyze the technical moves of a market. This is the accumulative knowledge about everybody analyzing a specific trading entity and acting upon that analysis. Candlestick signals provide the clearest form of visual analysis of how a total market has been analyzed. What is fundamental analysis? It is the evaluation of what future price moves should do based upon the current knowledge available and anticipation of future factors. Candlestick signals and patterns identify what the majority of investor sentiment is conveying. This is not rocket science! This is letting the market tell you what the market is doing.

Candlestick signals illustrate the temperament of investors. As witnessed in the Dow over the past few trading days, there was an indication the Bulls may be running out of steam. Was this the time to sell? The Bearish Harami, followed by a Shooting Star Doji and another Doji would indicate the possibility investment sentiment was losing its bullish force. However, one simple element has not occurred. Confirmation! Indecisive signals require confirmation. Otherwise, unless it can be confirmed the Bears were taking control, the uptrend has to be considered to still be in progress. What is one of the simple rules that allows candlestick investor’s to keep from being scared of the market? An uptrend requires selling confirmation to indicate it is time to take profits. Selling confirmation, in these market conditions, would require a candlestick sell signal followed by a close below the T. line. Today’s positive trading was an indication the market may have merely been resting, waiting for the T. line to catch up.

Fundamental Commodity Analysis, Dow

DOW

The simple rules applied the candlestick analysis are merely common sense. Candlesticks, utilized correctly, are very instructive for indicating when it is time to buy, time to hold, and then time to sell. If you are a beginning investor, learning candlestick analysis first would keep a lot of confusing misinformation from screwing up investors thought processes. Successful investing requires understanding what makes prices move as they do. It is often professed in the Candlestick Forum chat room’s that prices do not move based upon fundamentals, they move upon the perception of fundamentals. Teach this to your kids! They will have a much better understanding of how to invest their funds successfully.

When it becomes clear that prices move in reoccurring patterns, that is when an investor will be able to consistently produce profits from the markets. Unless you have unlimited resources and capabilities to follow many stocks, or factors that would influence trading entities such as commodities and currencies, candlestick analysis becomes the best format for taking advantage of factors that will influence specific price moves. Candlestick patterns illustrate the reoccurring investors thought processes that can produce very strong profits. As illustrated in the APL chart, the potential of a big price gain is based upon witnessing a scoop pattern in progress.

Fundamental Commodity Analysis, APL

APL

Knowing what the result of a pattern can produce allows an investor to put their funds to work in the best potential situations. The purpose of investing is to have your funds in high probability/high profit situations. This implies placing funds in situations with big upside potential yet a limited downside risk. Analyzing stock or commodity positions based upon the information built into candlestick signals allows for low risk situations. The ability to analyze market trends, or other trading entities that will influence the price movement of what you were trading, is a huge advantage. This ability is made very easy using the visual aspects of the candlestick signals.

Chat session tonight at 8 pm ET

Good Investing,
The Candlestick Forum Team


This Week’s Special

New Training Tutorials

Commodity & Futures Trading
Promotional pricing
25% Off for the next 3 days!

Click here for details

Website special reflects current newsletter. If you are reading an archived newsletter you will be directed to Current Website Special.

Technical Commodity Analysis

Technical commodity analysis goes back to the days of rice traders in 17th century Japan with Candlestick basicsCandlestick trading tactics date back to rice trading in the days of the Samurai. Today’s technical analysis of commodities may be faster when aided by online trading software but its roots are very old and tested by time. While fundamental analysis of commodity trading looks to reported events, numbers, economics and the like technical analysis of commodities derives from the Candlestick trading adage that the market itself will tell you what the market will do next. Technical commodities trading looks at commodity prices and price patterns, commodity market volume and changes in volume, and measures of commodity market volatility as technical indicators of the directions that commodities markets will next take. For those beginning commodity futures trading Options and Futures Training will give you a head start in understanding how technical commodity analysis can help you make a consistent profit in a commodities exchange.

Commodity Prices

Commodity price is the most important part of trading commodities. The commodity price is what traders buy and sell at and the difference minus commissions and fees is the trader’s profit. Everything else in technical commodity analysis is meant to help predict commodity prices. Technical analysis charts are fundamental to following and predicting commodity prices. Traders use Candlestick chart formations and their modern equivalents to predict commodity market reversals and continuation of market trends. Understanding support and resistance zones, for example, is typically much easier when looking at commodity price charts rather than columns of figures. Adding a moving average to a chart of commodity prices will make it much easier to see market direction.

Commodity Market Volume

Trading volume in commodities is important because a high trading volume gives the commodities market liquidity, making it easier to buy and sell in smaller price increments. High volume also tends to cause temporary market inefficiency as traders try to catch up with changes in market fundamentals or new technical indicators. The tuned in trader will make much of his or her profit during periods of high volume. The wise trader also knows that high trading volume often precedes a change in commodity market direction. He or she will use technical commodity analysis indicators such as the demand index in evaluating price and volume to know when a change in a commodity price trend will take place.

Commodity Market Volatility

Market volatility, like market volume, can be profitable for the commodity trader. Market volatility, like volume, increases market inefficiency, allowing the tuned in trader to make profits commodity trading online. Volatility comes with new market news and market indecision. High volatility with large differences between market highs and lows is often an indicator of a coming drop in commodity price while a narrowing trading channel if often an indicator of solidifying market sentiment and either a stable price or the start of an upward trend. The Swing Index is often used in technical commodity analysis to indicate the actual direction of the market during periods of high volatility by comparing opening, closing, high, and low commodity prices on the trading day and the previous day. As we mentioned above, Commodity and Futures Training is a great way to begin commodity training and a great refresher for the seasoned trader. May you do your homework and trade successfully.


Market Direction

The question was asked in Denver this weekend, how do you make big profits in a slow uptrending market? The answer is very simple. What does a slow uptrending market reveal about investor sentiment? It shows there is not any significant change of investor sentiment. This may sound like an obvious statement, however it has significant ramifications. When do Candlestick patterns work most effectively? When investor sentiment has a chance to develop into exuberant price moves. The longer a trend moves consistently in one direction, investors sentiment becomes more pronounced on an exponential basis. At some point, the general masses will finally become confident and start rushing back into the market. Unfortunately, that is usually an indication that a top is forming.

Technical Commodity Analysis, Dow

DOW

Having an understanding of the patterns that work most effectively allows investors to take advantage of big profit moves during a slow uptrend. The two primary patterns that are working most effectively right now are the Fry pan bottom breakouts and the J-hook patterns. Big price moves can be expected if the market direction does not change coming out of these patterns. There is not anything highly sophisticated about the analysis of candlestick patterns. They are the reoccurring visual depiction of how in investor sentiment operates. The J-hook pattern is formed by an initial strong price move. Something has occurred to make investor sentiment very bullish about getting into that trading entity. However, strong price moves bring about profit-taking. The advantage  candlestick signals provides is the ability to analyze whether a pullback is profit-taking or a full-scale reversal. Identifying the signals that would indicate merely profit-taking permits a candlestick investor to reenter the trade and participate in the next profit move.

Technical Commodity Analysis, AER

AER

Once again, we show our recent recommendation of AER. There are numerous stocks that have come up on our scans showing strong J- hook patterns. Even when the first portion of the price move may have been missed, the candlestick investor can take advantage of the next price move. This comes about by recognizing where the low risk entry point would be as well as a possible first resistance level.

Using candlestick signals and patterns allows for the preparation of potentially big price moves in either stocks or commodities. The analysis of soybean prices becomes airy simple when applying candlestick signals and moving averages. Note how the May Soybean chart shows a consolidation stage that had one consistent factor. The 200 day moving average clearly acted as a resistance level. The sideways trend channel clearly reveals the lack of bullish force to get above the 200 day moving average. This could lead to a failure of the lower trend channel. If that occurs, another strong down move, such as the one seen in January, could occur again. This makes placing short positions a high probability/high profit potential trade. Will that always occur? Not always, but the reoccurring results of investor sentiment makes the identification of candlestick signals at important technical levels a highly profitable activity.

Technical Commodity Analysis, May Soybeans

May Soybeans

Commodity trades have certain advantages over stock trades. Less outside influences allows a commodity trade to move in a trend direction with much more consistency been filed in a stock trade. Although commodity trading is highly leveraged, utilizing the information found in candlestick signals dramatically improves the risk/reward factor. It is very important to not only recognize and understand the high probability trade situations in commodities, is also very important to understand and control your own emotions. If you can control your own emotions while trading commodities, which are fast-moving highly leveraged trading entities, you then will have a very firm grasp on how to manage your stock positions.

Chat session tonight at 8 PM ET.

Good Investing,
The Candlestick Forum Team


This Week’s Special

Scanning Techniques to Higher Profits – On Sale at 50% Off regular price!

Click here for details

Website special reflects current newsletter. If you are reading an archived newsletter you will be directed to Current Website Special.

Anticipating the Stock Market

Stock traders commonly make their living anticipating the stock market and individual stocks. Stock prices fell recently in the tech sector after Apple reported worse than expected earnings. The US Federal Reserve beige report came out comments on the state of the US economy that only served to make market sentiment more depressed. Indices were down across the board. Many engaged solely in long term investing are waiting for the market to establish a clear bottom in order to profit from buying at the bottom of the curve. Likewise traders look to profit from a market reversal but also profit by selling short or trading options on various stocks or exchange traded funds trading market indices such as the S&P 500 . Making a profit in trading stocks requires skill in anticipating the stock market with both fundamental and technical analysis . Anticipating the market and individual stocks requires perspective. While Apple and other tech stocks such as HP and Cisco fell in price recently, Intel went up on a better than expected quarterly report. Using technical analysis tools like Candlestick charts traders are able to tap into market sentiment for stocks and broad market sectors. Using Japanese Candlestick charts traders commonly profit by anticipating the stock market.

Successful stock traders succeed at picking stocks to trade and at trading stocks that they pick. When anticipating the stock market traders first decide which aspect, sector, or stock in the market that they wish to follow. For example, some stocks are less volatile than others in both good and bad markets. Consumer stocks, health care, utilities, and telecommunications are less like to fluctuate in price as greatly as other stocks when the broader market goes up or down. In fact, these stocks sometimes move contrary to the broader market during a downturn as traders and investors buy these so called defensive stocks. Also, these stocks can fall in price during an economic recovery as investors sell stock in these companies in order to add growth stocks to their stock portfolio. No matter which stock or type of stock one chooses to trade the use of clear and easy to read Candlestick patterns helps in anticipating and profiting from the market.

The market reacts to the stock market news. One day the news indicates that the European Union is going to solve its debt dilemma. The next day we read that German voters are angry about spending money to bail out other countries and the debt relief plans are not go going forward. The market acts like a yo-yo, cycling up and down on speculation. Fundamentals are unclear and confusing. Nevertheless the market comes to a consensus and anticipating the stock market is the business of technical analysis. Traders using clear and objective Candlestick pattern formations are able to track stock price patterns. Every day and every hour traders using Candlestick signals read market sentiment and identify price patterns that help predict the next move of the market in general, a market sector, or prices of individual stocks. Whether trading stocks, commoditiesfutures, or Forex. Candlestick signals help traders anticipate the market.


Market Direction

How do you participate in big price moves when they gap up on the open? The candlestick charts were indicating the uptrend was in progress. This would have established long positions prior to a potential big price move. Today’s trading had for warnings of good strong moves based upon the premarket futures showing the T-line was going to remain as a support level and the 200 day moving average was not going to act as a resistance level. There were numerous price patterns that were bought over the past few days that allowed for big profits to be made today.

Candlestick signals and patterns work as efficiently on a daily chart as it does on the 1 min. chart. E-mini traders and YM traders should be prepared for some guest speakers over the next few weeks pertaining to day trading the Dow and the S&P 500. The candlestick signals allow you to make my with a high degree of probability if you are swing trading on daily charts or day trading on the 1 min. and 5 min. charts. Investor sentiment works the same way in all time periods.

Chat session tonight at 8 PM ET, Everyone is welcome!

Good Investing,


Website Special

Mini-Webinar on Moving Averages – NEW ON SALE!!!

Website special reflects current newsletter. If you are reading an archived newsletter you will be directed to Current Website Special

Commodity Trading Charts Easy-to-read With Candlestick Signals

Commodity trading charts are very easy to read using candlestick signals. Commodity trading charts are very important for investors using higher leveraged commodity trades. Candlestick signals clearly illustrate where reversals occur in price trends. They work more effectively on commodity trading charts than they do on stock trading charts. Commodity trading charts usually reveal a long and sustained trend. Commodities trade differently than stocks. They have less outside influences to affect the price trend. Candlestick signals reveal when these trend changes are occurring.

Commodity prices do not have numerous factors that will change a price trend. Most of the time, commodity prices move basically on supply and demand issues. That is the true nature of free markets at work. Candlestick signals pinpoint when a change of a major trend is going to occur. Investor sentiment is the true gauge for identifying when supply and demand is changing course. The Japanese Rice traders made fortunes trading the most basic of commodities, Rice. The information that is conveyed by the individual candlestick signals produces recognized formations. These formations/signals have not only been identified by Japanese Rice traders, they were able to evaluate what the investor sentiment was doing at these reversals. This information is very valuable when analyzing commodity trading charts. The same information is easily applied to any trading entity. Investor decisions remain constant throughout the centuries. Fear and greed become a vital part of the movement of prices.

Commodity traders gain a huge advantage when able to recognize reversal signals. The most proven and tested reversal signals are candlestick signals. They have been utilized successfully for centuries. Having a visual pattern that demonstrates the change of investor sentiment is a valuable cool. An investor that can recognize the reversal signals to have worked effectively for centuries improves their probabilities of being in the right trade at the right time. Each of the signals has advantageous elements. Whether a major signal or a secondary signal, applying candlestick analysis to commodity trading charts will dramatically improve an investor’s profits. Learn how to interpret these simple reversal signals, and the probabilities become greatly enhanced in the investor’s favor.
This Secondary Signal, The Three White Soldiers, is one of many strong reversal patterns.

3 White Soldiers Candlestick Pattern

Three White Soldiers

Description

The Three White Soldiers (also known as The Advancing Three White Soldiers) is a healthy market reversal pattern. It consists of three white candles, the second and third candles opening lower than the previous close but closing at a new high.
 
Criteria

  1. Each consecutive long candle closes with a higher open.
  2. The second and third candlesticks open in the previous day’s body.
  3. Each day should close very near its high for the day
  4. The opens should be within the top half of the previous day’s body.

Pattern Psychology
After a downtrend or a flat period, the presence of this formation suggests a healthy rally will occur. The strength of this formation consists of the fact that each day, the lower open suggests that sellers are present. By the end of each day, the buying has overcome the early sellers. This represents that a healthy continued rally has selling occurring as it is happening. As in any rally, too much buying with little selling can be dangerous. This Bullish reversal pattern needs no confirmation.

Candlestick Forum Flash Cards   These unique Flash Cards will allow you to be “trading like the Pro’s” in no time.

Winning with Commodities

Winning with commodities starts with learning the basics through commodities and futures training. Learning what commodities are and which commodity to trade is a start. Commodity prices as recorded in commodity trading charts give traders a useful view of the commodities marketsCommodity trading with the use of Candlestick chart analysis has helped traders since Candlestick basics were developed by rice traders in Japan centuries ago. Those traders were winning with commodities when the Samurai were in power by letting the market tell them what the market would do. To win with commodities the trader will need to understand basic and fundamental analysis of individual commodities as well as technical analysis. Through the use of technical analysis tools the trader will be able to predict commodity trends and market reversal. Through the use of Candlestick pattern formations the trader will have the tools necessary for winning with commodities.

Fundamentals of Commodity Trading

The fundamentals in commodities trading vary by commodity. The fundamentals for trading gold futures have to do with the economy and the ability to economically mine gold. Since many use gold bullion for hedging against inflation or even protection against economic and monetary collapse, a recession or persistent inflation will typically drive the price of gold up. Much of the gold in the developed world has been mined near to surface. Thus extraction is taking place at great depth in the mines of North America and South Africa. Newer mines where extraction is easier are often in developing and politically unstable countries. The commodity market for an agricultural product such as corn or soybeans will be very dependent upon the weather in the world’s major crop growing areas such as the United States Corn Belt. Knowing market analysis with the fundamentals is essential for winning with commodities for it is the fundamentals of supply and demand that will determine commodity price when the commodity futures contracts expire.

Technical Analysis of the Commodities Markets

Winning with commodities requires knowledge of technical analysis indicators such as used in Candlestick trading tactics. Although the fundamentals of any commodity are available to all traders the tactics used by each will differ. Thus trading commodities is a daily, hour by hour, minute by minute job as the trader watches and derives opportunity from the market. History repeats itself in large trading markets such that recognizable price patterns are predictive of future movement of a commodity futures price. Recognizing and knowing how to trade commodity trading signals is essential to winning with commodities. As we mentioned above commodities and futures training is essential to learn commodity trading or as a refresher in using tools such as Candlestick charting techniques. Knowing the fundamentals of a commodity is essential to commodity trading. Knowing and knowing how to use technical indicators is what makes daily winning with commodities possible. Everyone knows, or should know, the fundamentals of corn futures or copper futures if they are trading them. It is in anticipating both short and longer term price movement of a commodity that profits are made.

Market Direction

Did you make money last week as the markets were going down? Many people lost money. As a candlestick investor, you should have been making money. Why? Because you could have looked at the charts and be informed on what the market was doing. What were the indications? The advantage of learning from candlestick analysis provides valuable insights. These insights can be learned from common sense of evaluation, not years and years of market trading experience.

The Japanese Rice traders pointed out specific market conditions that would show a probable change of investor sentiment. The signals are the primary indicators of course. However, there are additional indicators the Rice traders explained as sentiment changers. Watching great volatility coming into the market is an indicator. The extensive magnitude of price movement reveals  great indecision between the Bulls and the Bears. The simple rule of prices trading below the tee line was another indication the downtrend probabilities have expanded. After a bullish trading day last Monday, there was the possibility the uptrend could continue. Waking up to very bearish premarket futures he next day  should have been another indication the Bulls could not keep the markets above the tee line. During all this whipsaw action, the stochastics were moving in a downward direction. Once the indexes had moved significantly below the tee line, the commonsense evidence was now favoring a downtrend. This should have stimulated the portfolio positioning moving toward short positions or at least back to cash.

Winning with Commodities, Dow May Example

DOW

Why did most people not make money during the downtrend? What was still the predominant image of the market? A long steady uptrend! This is what keeps most investors hanging onto long positions well past their prime. A pullback in an uptrend is not unexpected. Unfortunately, most investors are hoping the pullback will be short-lived and the markets will continue its previous uptrend. This thought process becomes prevalent because the long slow uptrend had produced great expectations. This is where emotional trading usually prevails in most investors trading platform. There is only one productive way to keep from falling into that trap. Look at the chart with a completely unbiased point of view. Although you may be holding long positions, you have to ask yourself honestly what is the chart telling. If it reveals that it is moving in a direction of exsing positioig, wth no indication of a reversal, an investor has to make an unemotional decision to sell positions that do not look like there is strong upside potential.

Winning with Commodities, Second Dow May Example
DOW This Week

Will all pullbacks provide the opportunity of huge profits like we saw on Thursday’s trading? Definitely not, but why put yourself in a position where you do not have the opportunity to take advantage of a downward move. If you keep in mind that it takes approximately 7 seconds to change or add or delete a position from your portfolio, you minimize the mental block of selling a position and buying it right back if it appears as if selling the position was not the correct thing to do.

The panic selling of Thursday could be easily identified. When prices start jumping on the downside, it can be assumed that the panic selling is occurring and no buyers are stepping in, YET!!!

Watch your five-minute chart and your one minute chart to reveal when the panic selling is over and Bulls are starting to step back in. The panic sell we saw on Thursday is a market condition that may be seen only once every 5 to 10 years. Knowing what to look for on a one minute candlestick chart will make those days extremely profitable. The charts reveal when it is time to cut through the emotional selling.

Today’s bullish trading ‘may’ have changed the bearish sentiment. That is not 100% guarantee though. Both the Dow and the NASDAQ closed below the tee line. Tomorrow’s pre-market futures will indicate whether the tee line will still act as resistance or whether the market can push up through that resistance.

Chat session tonight at 8 PM ET

Good Investing,
The Candlestick Forum Team


This Week’s Special
 
Projecting Price Targets – Quickly learn to spot the most profitable price targets! – BONUS EBOOK with purchase!!!
 
2-Day-Commodity Training Webinar
 
Click here for details
Website special reflects current newsletter. If you are reading an archived newsletter you will be directed to Current Website Special.

Commodities Tips

Commodities Tips for New Investors

Today’s article will cover commodities tips that every investor should follow. Not only do a lot of these tips apply to commodity trading, but they also apply to other forms of trading and investing as well. Read the commodities tips below to find where you maybe be able to improve.

Don’t push it – Sometimes the best trade you can make is no trade at all. You are not trading for the sake of trading, you are trading to make money and improve your lifestyle. If the signal says to stay away from the trade, then stay away from the trade! Don’t force it and end up putting yourself in a no-win situation when trading commodities.

Don’t trade angry – You have heard other tips such as don’t drive angry, don’t go to bed angry, etc. Well, this rule of thumb should also be applied towards online commodity trading! When your emotions are running high, you are more likely to make mistakes. You are not performing at your best because you are not fully concentrating on the task at hand. If you are angry, or emotional in any way then don’t trade!

Diversify with non-correlated commodities – Commodities tips of this nature state that you must diversify by trading different families of futures contracts. You must look for some of the least correlated groups and invest in those in order to diversify your portfolio.

High probability trades are just that – The point is to look for high probability trades to invest in. That means that they won’t work every single time, so don’t take it personally when they don’t. If something changes with the signal, don’t stay in the game in “hopes” that things will go your way again.

Stay away from “hot” tips – If you receive a so called “hot” tip via mass email or find out about a hot commodity from the media, then its probably too late. Profits have already been made and if you jump in now you are only going to lose money.

Don’t make excuses – When you lose on a trade, accept responsibility, learn from it and move on. Not only commodities tips, but all other investing tips will tell you the same thing. There are no guarantees and you will lose from time to time. You knew when you analyzed your investment options, and starting investing, that you would lose money at times. As long as you are winning overall, that’s what counts!

You must paper trade – You must practice online paper trading before you begin to trade with real money. Paper trade the system that you have developed and you will make money. You must however keep in mind that when you actually trade with real money, anxiety, fear and all kinds of emotions kick in that can alter your perceptions. You must learn to recognize these emotions and learn how to control them in order to trade successfully.

There are many more commodities tips available online.  You must continue to research as much about trading commodities online before you begin and remember to paper trade first before you begin placing trades with real money. You will be glad that you did!


Market Direction

Where does the market go from here? After a very boring and languishing summer, the results of the Dumpling Top produced strong profits if you took advantage of the short funds. Additionally, after a severe downtrend, some big profits were made by covering short fund positions and utilizing the basic rules of candlestick analysis. Where do people sell? They panic sell at the bottom.

How did we know that Friday was a potential bottom day? The Japanese rice traders say “When you see prices gap down in the oversold condition, start watching for candlestick by signals.” Friday morning, the pre-market futures were down excessively, indicating that at least the NASDAQ would be gapping down. If you follow candlestick logic, it was easy to realize that the excess of bearish indication of Friday morning’s pre-market futures was probably representing the panic selling in the oversold conditions.

Commodities Tips, NASDAQ

NASDAQ

Commodities Tips, Dow

DOW

This does not take extensive analysis. When the Dow moves down hundreds of points in the first few minutes of trading, after an extended downtrend, it becomes relatively clear that panic selling has now hit the market. This provided for some excellent deep discount entry points for stocks that were just getting decimated. Panic selling and the margin calls were making for some huge profit potentials. Knowing these simple principles allows investors to get through the emotional trauma of trying to buy at what most people consider very scary times in the market. The question always comes back to a very simple premise. When everybody is panic selling, who is buying? As illustrated in our trade in FTEK, the extreme gap down in price well in the oversold condition allowed for some hefty profits and a 2/3 day period. Before candlestick signals came along, I would never have been able to buy at the bottom. I would have been the one selling at the bottom.

Commodities Tips, FTEK

FTEK

Now that the markets have completed the last move following the Dumpling Top, what is next? Today’s trade was a very important indication of what was occurring. Had prices gone down further, the bearish Jay hook pattern would now be in progress. Knowing what we know about the Jay hook pattern, the next viable target would have been at least 1000 points lower. A bullish trading today created a hammer type signal in the Dow and a hammer/harami in the NASDAQ. Consider what has occurred over the past five days. The NASDAQ formed a spinning top/meeting line signal on Friday, followed by a gap up in price. This shows definite evidence of the bulls coming back into the market. The following two days showed continued selling, the residue selling from this current downtrend. Today’s bullish Harami illustrates the Bulls are once again coming back into the market. What would we need for more confirmation? Tomorrow’s trading closing above the T-line. What do we not want to see if we’re expecting a bullish trend? A close more than halfway down today’s bullish candle. Does this mean a strong uptrend is about ready to start? Not necessarily, but the longer the bullish sentiment stabilizes the market, the better the probabilities the bearish/negative sentiment will start dissipating.

Candlestick signals provide an immense amount of analytical information. Each signal alone provides a view into investor thought processes. A few signals in proximity to each other can now be evaluated with a better understanding. Investor sentiment is about to change, although it may not change dramatically in one day.
Chat session tonight at 8 PM ET — everybody is welcome. There are many dramatic reversal signals occurring in this market. We will be discussing what is going on in the current trend and setting up strategies for taking advantage of some possible big price moves. If you already have HotComm installed, click here to connect.

Good investing,

The Candlestick Forum Team


This Week’s Special

Projecting Price Targets PLUS Bonus Ebook
Click here for details.

Website special reflects current newsletter. If you are reading an archived newsletter you will be directed to Current Website Special.

Technical Analysis That Produces Big Profits!

Technical analysis is identifying indicators that show reoccurring results. Candlestick signals are the ultimate Technical analysis indicators. The signals have been identified over centuries of observations. The utilization of the Candlestick signals, in conjunction with other technical analysis indicators, produces a strong visual format for investors.

The purpose of investing is to maximize profits. The most powerful element of the Candlestick signals is revealing reversals in price trends. Understanding the investor psychology that creates the signals, provides a powerful insight for investors. That insight not only helps the investor to recognize price reversals, it also gives the investor the knowledge of what moves prices in general. This is a very potent investment tool. That knowledge makes technical analysis a highly profitable format for consistent extraction of profits of the markets. Candlestick charts make these profit probabilities much easier to visualize.

The study of Candlestick analysis not only identifies price trend reversals, but some simple technical analysis applications help identify powerful trend reversals. One of the most compelling trade set-ups is the use of a Candlestick reversal signal followed by a gap in price. Gaps, or in Japanese terminology “Windows”, provide very relevant investment information. The Candlestick signals represent a reversal of investor sentiment from the previous trend. A gap following that signal illustrates dramatic strength in the new sentiment.

Good profits can be made knowing where a reversal is occurring. Big profits can be made knowing which reversals have the biggest potential. This is the ultimate usage of Technical analysis. Most Technical analysis methods will “suggest” where a reversal might occur. The Candlestick signals illustrate exactly when and where a trend reversal occurs. Identifying a Doji in an oversold condition followed by a gap-up, or recognizing a Kicker signal forming, allows a Candlestick investor to participate in the early stages of a very strong trend reversal.

Option Trading – Having the ability to recognize the beginning of powerful price moves not only makes for high profit stock trades, it becomes a strong technical analysis format for option trading strategies. Being able to recognize a high probability high profit move in a stock price makes the analysis of an option trade much easier.

A gap-up after a Candlestick signal incorporates three major factors involved in stock option technical analysis. Direction, time, and magnitude are much easier to assimilate into an option trade evaluation when a gap occurs.
The Whirlpool Corp. chart clearly illustrates a beneficial use of Candlestick analysis.

July 18th shows a Kicker signal. A Kicker signal is formed when the price gaps up to where it is opening at or above the previous day’s open. From there, the price continues to move in opposite direction of the previous day’s price direction. The signal indicates a dramatic change of investor sentiment. Not only did that sentiment change, it did so with great force. Understanding the implications of the Kicker signal not only provides for a strong stock trade, it also produces excellent option trades.

Kicker Signal Whirlpool

Kicker Signal Whirlpool

When the direction of a price is identified, and the potential of a strong move occurring during a certain time period can be projected, a multitude of options strategies can be implemented. In this case, the force-potential of the move produced a specific option strategy due to the amount of time until the next option expiration. Had the expiration time been much shorter, a strategy such as buying the July 75 calls and selling the July 80 calls would have been a much more profitable trade program. (Option trading strategies will be discussed in more detail in the ‘Members Only’ chat session on Monday night, August 1.)

Kicker Signal

KICKER SIGNAL
( Keri Ashi )

Description

The Kicker Signal is the most powerful signal of all. It works equally well in both directions. Its relevance is magnified when occurring in the overbought or oversold area. It is formed by two candles. The first candle opens and moves in the direction of the current trend. The second candle opens at the same open of the previous day, a gap-open, and heads in the opposite direction of the previous day’s candle. The bodies of the candles are opposite colors. This formation is indicative of a dramatic change in investor sentiment. The Candlesticks visually depict the magnitude of the change.

Criteria

  1. The first day’s open and the second day’s open are the same. The price movement is in opposite directions from the opening price.
  2. The trend has no relevance in a Kicker situation.
  3. The signal is usually formed by surprise news before or after market hours.
  4. The price never retraces into the previous day’s trading range.

Signal Enhancements

  1. The longer the candles, the more dramatic the price reversal.
  2. The opening from yesterday’s close to yesterday’s open already is a gap. However, gapping away from the previous day’s open further enhances the reversal.

Pattern Psychology

The Kicker Signal demonstrates a dramatic change in the investor sentiment. Something has occurred to violently change the direction of the price. Usually a surprise news item is the cause of this type of move. The signal illustrates such a change in the current direction that the new direction will persist with strength for a good while.
There is one caveat to this signal. If the next day prices gap back the other way, liquidate the trade immediately. This does not happen very often, but when it does, get out immediately.

Kicker Signal Thumbnail