The Seven Deadly Sins of Option Trading – Free E-Book Download


Alter Your Investment Perceptions Forever!
The Seven Deadly Sins of Option Trading – Free E-Book Download
HOW TO TRADE THE DOJI SIGNAL
HOW TO TRADE THE BULLISH ENGULFING SIGNAL
HOW TO TRADE THE BEARISH ENGULFING SIGNAL
HOW TO TRADE THE HAMMER SIGNAL
HOW TO TRADE THE HANGING MAN SIGNAL
HOW TO TRADE THE PIERCING PATTERN
HOW TO TRADE THE DARK CLOUD SIGNAL
HOW TO TRADE THE BULLISH HARAMI
HOW TO TRADE THE BEARISH HARAMI
HOW TO TRADE THE MORNING STAR
HOW TO TRADE THE EVENING STAR
HOW TO TRADE THE KICKER SIGNAL
HOW TO TRADE THE SHOOTING STAR
HOW TO TRADE THE INVERTED HAMMER
Learning about the stock market for personal stock market investing can be very costly if not approached in the right manner. Attributes built into candlestick charts greatly reduce the potential of losses while learning about the stock market. The knowledge conveyed in just one of the 12 major signals helps investors understand the dynamics of what makes price move. This is true for investors that are just learning about the stock market all the way up to experienced traders. The candlestick charts are in use today because they have worked effectively throughout the centuries. Japanese Rice traders recognized that investor sentiment operates in reoccurring patterns. They recognized candlestick charts provided patterns that would reoccur as a trend was about ready to reverse. This became valuable information. The psychological elements that are incorporated into the major candlestick signals makes learning about the stock market easier and more profitable.
Out of a universe of 50 to 60 candlestick reversal signals, it has been found that only 12 of the signals require attention. These 12 major signals will provide more trade situations than most investors will be able to utilize. The insights gained from dissecting each of the 12 major signals becomes a valuable tool for learning about the stock market. The common complaint for most investors learning to read candlestick charts was there were too many candlestick signals. When learning the stock market, an investor wants a proven investment technique.
andlestick charts produces a very strong trading platform the candlestick signals have proven themselves to work. The question is not whether they work or not, the question is whether somebody can learn how to use them correctly. The Candlestick Forum is a stock market education site that takes candlestick charts and individual candlestick signals and reduces the information down to the basic elements. If each signal is dissected and studied, the information that the signal conveys will become a powerful investment tool for the rest of your life. The knowledge presented in Candlestick Charts makes learning the stock market, or any other trading market, much easier to understand. Each signal provides an immense amount of information.
One of the most visually compelling signals is the Hammer signal. The hammer signal is easily recognized by the lower shadow ( the tail ) protruding to the downside after an extended downtrend.
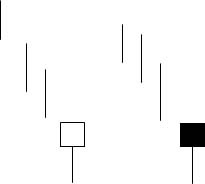
HAMMERS AND HANGING MAN
Description
The Hammer is comprised of one candle. It is easily identified by the presence of a small body with a shadow at least two times greater than the body. Found at the bottom of a downtrend, this shows evidence that the bulls started to step in. The color of the small body is not important but a white candle has slightly more bullish implications than the black body. A positive day is required the following day to confirm this signal.
Criteria
Signal Enhancements
Pattern Psychology
After a downtrend has been in effect, the atmosphere is very bearish. The price opens and starts to trade lower. The bears are still in control. The bulls then step in. They start bringing the price back up towards the top of the trading range. This creates a small body with a large lower shadow. This represents that the bears could not maintain control. The long lower shadow now has the bears questioning whether the decline is still intact. A higher open the next day would confirm that the bulls had taken control.
Training Tutorials
The Major Signals Educational Package has over 8 Hours of training for trading Candlestick Signals or The Hammer individual training video available for Quick Download.
Candlestick Forum Flash Cards These unique Flash Cards will allow you to be “trading like the Pro’s” in no time.
NOT from well-kept investment “secrets”
NOT from “new” sophisticated formulas that promise amazing profits.
You can learn how to make huge and consistent profits from the world’s most proven and successful trading technique. Candlestick trading has compelling results.
Backed by a mountain of scientific research – and proven results for thousands of investors – the candlestick trading methods taught on this site will improve your investment results faster and with less effort than you ever dreamed possible!
Young, old, male, female, new at investing or a sophisticated trader, everybody can dramatically improve their investment returns using simple Japanese Candlestick analysis. If you can see, you can learn candlestick trading. Candlestick signals provide invaluable insights into the direction of a trend.
Review the chart of SeaChange Intl. below. This candlestick formation is called a Bullish Engulfing pattern. It appears at a point that stochastics indicate this stock is oversold. It is a candlestick signal that indicates a major reversal. It visually illustrates when to start buying this stock. No interpretation of trend lines, no calculation of difficult formulas. Just simple visual recognition of a Japanese Candlestick buy signal. Candlestick investing is simple visual identification.
The accuracy found in the Japanese Candlestick signals produces amazing results not found in any other investment method. The Candlestick Forum has developed techniques to take advantage of the information conveyed by the signals. On this site, you will learn.
Hello! My name is Steve Bigalow, and for 25 years, I have searched for the “Holy Grail” to consistent investment profits. Name any investment technique ever invented and I have probably tried it. Then, a little over 15 years ago, I discovered Japanese Candlesticks. For the past 15 years, I have developed and refined techniques using the Japanese Candlesticks to consistently pull profits from any kind of market. Bull or bear, stocks, commodities, or tulip bulbs, it doesn’t matter. All you need to know is how to recognize the easily-seen signals the Japanese Candlesticks create.
My program will accelerate your investment knowledge and net wealth in ways that will absolutely amaze you.
PCF’s written in TeleChart searches for The Major Candlestick Signals
The following criteria for Major Candlestick Signals is provided for your convenience. Follow TeleChart instructions for adding search criteria, then ‘cut-and-paste’ the formulas below.
You will also find these posted in the Candlestick Forum club on TeleChart. Join Steve and fellow candlestick traders by adding the Candlestick Forum club to your directory.
Doji
(O = C )
Doji Yesterday
(O1 = C1 )
Doji and Near Doji
(ABS(O – C ) <= ((H – L ) * 0.1))
Bullish Engulfing
((O1 > C1) AND (C > O) AND (C >= O1) AND (C1 >= O) AND ((C – O) > (O1 – C1)))
Bearish Engulfing
((C1 > O1) AND (O > C) AND (O >= C1) AND (O1 >= C) AND ((O – C) > (C1 – O1)))
Hammer
(((H-L)>3*(O-C)AND((C-L)/(.001+H-L)>0.6)AND((O-L)/(.001+H-L)>0.6)))
Hanging Man
(((H – L) > 4 * (O – C)) AND ((C – L) / (.001 + H – L) >= 0.75) AND ((O – L) / (.001 + H – L) >= .075)))
Piercing Line
((C1 < O1) AND (((O1 + C1) / 2) < C) AND (O < C) AND (O < C1) AND (C < O1) AND ((C – O) / (.001 + (H – L)) > 0.6))
Dark Cloud
((C1 > O1) AND (((C1 + O1) / 2) > C) AND (O > C) AND (O > C1) AND (C > O1) AND ((O – C) / (.001 + (H – L)) > .6))
Bullish Harami
((O1 > C1) AND (C > O) AND (C <= O1) AND (C1 <= O) AND ((C – O) < (O1 – C1)))
Bearish Harami
((C1 > O1) AND (O > C) AND (O <= C1) AND (O1 <= C) AND ((O – C) < (C1 – O1)))
Morning Star
((O2>C2)AND((O2-C2)/(.001+H2-L2)>.6)AND(C2>O1)AND(O1>C1)AND((H1-L1)>(3*(C1-O1)))AND(C>O)AND(O>O1))
Evening Star
((C2 > O2) AND ((C2 – O2) / (.001 + H2 – L2) > .6) AND (C2 < O1) AND (C1 > O1) AND ((H1 – L1) > (3 * (C1 – O1))) AND (O > C) AND (O < O1))
Bullish Kicker
(O1 > C1) AND (O >= O1) AND (C > O)
Bearish Kicker
(O1 < C1) AND (O <= O1) AND (C <= O)
Shooting Star
(((H – L) > 4 * (O – C)) AND ((H – C) / (.001 + H – L) >= 0.75) AND ((H – O) / (.001 + H – L) >= 0.75)))
Inverted Hammer
(((H – L) > 3 * (O – C)) AND ((H – C) / (.001 + H – L) > 0.6) AND ((H – O) / (.001 + H – L) > 0.6)))
Recent Formulas Submitted by our Candlestick Forum Members
These have not been tested by the CandlestickForum
J-Hook Pattern
((L1 = MINL4) OR (L2 = MINL4) OR (L3 = MINL4) ) AND
( (MAXC3 < MAXC4.3)) AND
( (H3 = MAXH15.4) OR (H4 = MAXH15.4) OR (H5 = MAXH15.4) OR (H6 = MAXH15.4) OR (H7 = MAXH15.4) ) AND (((MAXH4.3 – MINL4) / (MAXH4.3 – MINL21.3) > .23) AND ((MAXH4.3 – MINL4) / (MAXH4.3 – MINL21.3) < .62) ) AND
((AVGH3.5) > (AVGH3.8 ) AND (AVGH3.8 ) > (AVGH3.13) AND (AVGH3.13) > (AVGH3.18 ))
Belt Hold
C > O
AND L = MINL10
AND ((C – O) / (H – L)) > .5
AND ((C1 – L) / (H – L) > .6)
AND (H – L) > .2 * ((H5 – L5) + (H4 – L4) + (H3 – L3) + (H2 – L2) + (H1 – L1))
AND H > L1 AND C < H1
Belt Hold
(C > O) AND (H > L1) AND (L = MINL10) AND
((C – O) / (H – L) > .5) AND
(ABS(C1 – L) / (H – L) > .5) AND
( (H – L) > (((H – L + ABS(C1 – H) + ABS(C1 – L)) / 2 + (H1 – L1 + ABS(C2 – H1) + ABS(C2 – L1)) / 2 + (H2 – L2 + ABS(C3 – H2) + ABS(C3 – L2)) / 2 + (H3 – L3 + ABS(C4 – H3) + ABS(C4 – L3)) / 2 + (H4 – L4 + ABS(C5 – H4) + ABS(C5 – L4)) / 2) / 5))
Three Outside Down Pattern
((C2>O2)AND(O1>C1)AND(O1>=C2)AND(O2>=C1)AND((O1-C1)>(C2-O2))AND(O>C) AND (C
Three Outside Up Pattern
((O2>C2)AND(C1>O1)AND(C1>=O2)AND(C2>=O1)AND((C1-O1)>(O2-C2))AND (C>O)AND (C>C1))
Three Inside Up Pattern
((O2>C2)AND(C1>O1)AND(C1<=O2)AND(C2<=O1)AND((C1-O1)<(O2-C2))AND(C>O)AND(C>C1)AND(O>O1))
Three Inside Down Pattern
((C2>O2)AND(O1>C1)AND(O1<=C2)AND(O2<=C1)AND
((O1-C1)<(C2-O2))AND(O>C)AND(C>C1)AND (O< p=””><>
Three White Soldiers PCF
(C>O*1.01) AND(C1>O1*1.01) AND(C2>O2*1.01) AND(C>C1) AND
(C1>C2) AND(OO1) AND(O1O2) AND
(((H-C)/(H-L))<.2) AND(((H1-C1)/(H1-L1))<.2)AND(((H2-C2)/(H2-L2))<.2)
Three Black Crows PCF
(O > C * 1.01) AND (O1 > C1 * 1.01) AND (O2 > C2 *
1.01) AND (C < C1) AND (C1 < C2) AND (O > C1) AND (O < O1) AND
(O1 > C2) AND (O1 < O2) AND (((C – L) / (H – L)) < .2) AND
(((C1 – L1) / (H1 – L1)) < .2) AND (((C2 – L2) / (H2 – L2)) < .2)
SIMPLE MOVING AVERAGE SCANS
Crossing Up Through 50SMA (you may replace the 50 with other MA’s)
AVGC50 <= H AND AVGC50 >= L
Price under 50 Moving Average Yesterday – Over 50 Moving Average Today
C > AVGC50 AND C1< AVGC50
Bounce off 50MA Yesterday
AVGC 50.1 <= H AND AVGC50.1 >= L AND C > C1 AND C > AVGC50
Price Crossing over the 50MA and 20MA Today
(C > AVGC50 AND AVGC20 ) AND (C1 < AVGC50.1 AND AVGC20.1 )
Crossing Up Through 200SMA
AVGC200<=H AND AVGC200>=L
Stochastics Moving Up Through 20
STOC12.3.1 < 20 AND STOC12.3 > 20
April 2007 -New Formulas submitted by fellow Candlestick Forum Members for TeleChart Users
Thanks to everyone who emails their formulas on Candlestick Personal Criteria Formulas. These are not tested by us and provided as a courtesy. Please contact the Worden Brothers at Telechart2007 for all pcf support.
BULLISH PATTERNS
Abandoned Baby
C2
H1>L2 AND
(C1+O1)/2>=((H1+L1)/2)*0.40 AND
(C1+O1)/2<=((H1+L1)/2)*0.60 AND
ABS(C1-O1)<= (H1-L1)*10 AND
L>H1 AND
C
*Sort in ascending order*
Breakaway
C4
C3
C>O AND
C>H3
*Sort in ascending order*
Concealing Baby Swallow
O3=H3 AND
C3=L3 AND
O2=H2 AND
C2=L2 AND
C1
O=H AND
C=L AND
H>H1 AND
L
*Sort in ascending order*
Doji Star
C1
L>H1 AND
ABS(C-O)<= (H-L)*0.05 AND
((C+O)/2)-L >= (H-L)*0.40 AND
((C+O)/2)-L <= (H-L)*0.60
*Sort in ascending order*
Hammer/Dragonfly Doji
((((CO)*O))*(-1))-L>=(H-L)*0.75 AND
(H-L)>(AVGH21-AVGL21)
*Sort in ascending order*
Harami Cross
ABS(C1-O1)>(H1-L1)*0.50 AND
C1
(((C+O)/2)-L) > (H-L)*0.40 AND
(((C+O)/2)-L) < (H-L)*0.60 AND
ABS(C-O) < (H-L)*0.20
*Sort in ascending order*
Homing Pigeon
C1
ABS(C1-O1)>(H1-L1)*0.50 AND
H
C
*Sort in ascending order*
Inverted Hammer/Gravestone Doji
ABS(C-O) <= (H-L)*0.25 AND
((C+O)/2) – L <= (H-L)*0.25 AND
H-((C+O)/2)>= (((C+O)/2)-L)*0.34
Ladder Bottom
O4>C4 AND
O3
C>O AND
O>O1
*Sort in ascending order*
Mat Hold
C4>O4 AND
ABS(C4-O4)>(H4-L4)*0.50 AND
C3
C2>L4 AND
C1>L4 AND
C>C4 AND
C>O AND
(H-L)>(AVGH21-AVGL21) AND
C2
ABS(C2-O2)<= ABS(C4-O4)*0.75 AND
ABS(C2-O2)<= ABS(C4-O4)*0.75
*Sort in descending order*
Matching Low
(C1ABS(C1-O1)>(H1-L1)*0.50 AND
C
*Sort in ascending order*
Meeting Lines
C1
O1
CC>C1*0.99
*Sort in ascending order*
Rising Three Methods
(C4>O4) AND
(H4-L4)>(AVGH21.4-AVGL21.4) AND
C2
ABS(C3-O3)<=ABS(C4-O4)*0.75 AND
ABS(C2-O2)<= ABS(C4-O4)*0.75 AND
ABS(C2-O2)<= ABS(C4-O4)*0.75 AND
C>O AND
(H-L)>(AVGH21-AVGL21) AND
C>C4
*Sort in descending order*
Stick Sandwich
C2
L1>C2 AND
C
C
*Sort in ascending order*
Three Inside Up
ABS(C1-O1) >= (H2-L2)*0.70 AND
ABS(C2-O2)>(H2-L2)*0.50 AND
C1>O1 AND
C2
C>O AND
C>C1
*Sort in ascending order*
Three Outside Up
ABS(C2-O2)>(H2-L2)*0.50 AND
C2
O1
C>C1
*Sort in ascending order*
Tweezer Bottom
L=L1 AND
ABS(C-O)ABS(C1-O1)>=(H1-L1)*0.90 AND
(H1-L1)>=(AVGH20-AVHL20)*1.3
*Sort in ascending order*
BEARISH PATTERNS
Advance Block
(H-L)>(AVGH21-AVGL21) AND
ABS(C1-O1)>(H1-L1)*0.50 AND
ABS(C2-O2)>(H2-L2)*0.50 AND
C>C1 AND
C1>C2 AND
O1> O2 AND
O1< C2 AND
O>O1 AND
O
(H1-L1) < (H2-L2)*0.80 AND
(H-C)>(O-L) AND
(H1-C1)>(O1-L1)
*Sort in descending order*
Belt Hold
C>O AND
C>H*0.98
*Sort in descending order*
Breakaway
ABS(C4-O4)>(H4-L4)*0.50 AND
C4>O4 AND
C3>O3 AND
L3>H4 AND
C2>C3 AND
C1>C2 AND
C
*Sort in descending order*
Dark Cloud Cover
ABS(C1-O1)>(H1-L1)*0.50 AND
C1>O1 AND
O>H1 AND
C<((C1+O1)/2) AND
C>O1
*Sort in descending order*
Deliberation
ABS(C2-O2)>(H2-L2)*0.50 AND
ABS(C1-O1)>(H1-L1)*0.50 AND
C1>C2 AND
C2>O2 AND
C1>O1 AND
O>H1 AND
(((C+O)/2)-L) > (H-L)*0.40 AND
(((C+O)/2)-L)<(H-L)*0.60 AND
ABS(C-O)<(H-L)*0.60
*Sort in descending order*
Doji Star
ABS(C1-O1)>(H1-L1)*0.50 AND
O>C1 AND
ABS(C-O)<(H-L)*0.05 AND
(H-L)<(AVGH21-AVGL21)*0.20
*Sort in descending order*
Dragonfly Doji/Hanging Man
(((C<=O)*O)+ ((C>O)*C))>(H*0.95) AND
((((C<=O)*C)+ ((C>O)*O)) – L) > (H-L)*0.75
*Sort in descending order*
Engulfing
C1>O1 AND
C1
*Sort in descending order*
Evening Doji Star
ABS(C2-O2)>(H-L)*0.50 AND
C2>O2 AND
ABS(C1-O1)<(H1-L1)*0.05 AND
(H1-L1)<(AVGH21.1-AVGL21.1)*0.20 AND
O1>C2 AND
C
*Sort in descending order*
Falling Three Methods
ABS(C4-O4)>(H4-L4)*0.50 AND
C4
H3<=H4 AND
L2>=L4 AND
H2<=H4 AND
L1>=L4 AND
H1<=H4 AND
H2>H3 AND
H1>H2 AND
C
*Sort in descending order*
Grave Stone Doji/Shooting Star
ABS(C-O)<(H-L)*0.33 AND
O>C1 AND ((C+O)/2)-L<(H-L)*0.4 AND H=MAXH10
*Sort in descending order*
Hanging Man
(((C<=O)*C)+ ((C>O)*O))-L)>=ABS(C-O)*2 AND
(((C+O)/2)-L)> (H-((C+O)/2))*2 AND
ABS(C-O)>.01
*Sort in descending order*
Identical Three Crows
C2
O1=C2
*Sort in descending order*
In Neck
ABS(C1-O1)>(H1-L1)*0.50 AND
C1
(C/C1)<1.05
*Sort in ascending order*
Meeting Lines
C1
O1
CC>C1*0.99
*Sort in ascending order*
Three Black Crows
O1
O
C1
*Sort in descending order*
Three Inside Down
ABS(C2-O2)>(H1-L1)*0.50 AND
C2>O2 AND
C1
C
*Sort in descending order*
Three Line Strike
C2>C3 AND
C1>C2 AND
(H3-L3)> (AVGH21.3-AVGL21.3) AND
(H2-L2)> (AVGH21.2-AVGL21.2) AND
(H1-L1)> (AVGH21.1-AVGL21.1) AND
O>O3 AND
C
*Sort in descending order*
Three Outside Down
C2>O2 AND
C2
C
*Sort in descending order*
Tweezer Top
H=H1 AND
ABS(C-O)ABS(C1-O1)>=(H1-L1)*0.90 AND
(H1-L1)>=(AVGH20-AVHL20)*1.3
*Sort in descending order*
Upside Gap Two Crows
ABS(C2-O2)>(H2-L2)*0.50 AND
C2>O2 AND
L1>H2 AND
C1
C
*Sort in descending order*
![]()
Don’t you love just throwing away money? Oh, not one of your favorite things? Well, most people feel the same way so jumping into something like futures trading is pretty scary. The good news is that you can learn by throwing away some virtual money and not the real stuff with something called paper trading futures. Thanks to the wonderful world of the Internet, paper trading futures is an easy, free way to simulate futures trading without the financial risk. Before we go deeper into paper trading futures, let’s talk about futures trading in general.
Futures trading is different from investing in the stock market or bonds since you don’t actually own anything; in futures trading, you are speculating on the future direction of the price in the commodity you are trading. This is like a bet on future price direction. The terms “buy” and “sell” merely indicate the direction you expect future prices will take. He or she must only deposit sufficient capital with a brokerage firm to insure that he will be able to pay the losses if his trades lose money. (Notice the words “pay the losses”. When paper trading futures, you can ignore those nasty words!)
Futures trading is a sort of insurance plan for those who are trading and investing. A farmer may sell futures on his wheat crop if he thinks the price will go down before the harvest; conversely, a bread manufacturer may buy futures if they think the price of wheat is going to rise before the harvest. Regardless of the price movement, both are guaranteed their price. The final component of the equation is the investor in futures trading who looks for changes in the futures markets and seeks to gain advantages by buying or selling at a profit.
The Potential of Futures Trading
Trading futures is an excellent way to make money. It is said that Richard Dennis, a famed commodities trader, was able to parlay $1,600 of borrowed money into $200 million over ten years. Futures trading has a bad reputation as being filled with risk and while there is risk; the truth is that futures trading is only as risky as a trader makes it. This is not the lottery or a trip to the casino; if you take a conservative approach, look for a reasonable return and make this a business then the probability of success in commodity trading is very good. The downside of paper trading futures is that even if you amass a $200 million fortune, you can’t collect it. Remember we’re just learning while paper trading futures…you can spend real money when you open a commodities account!
Getting Started Paper Trading Futures
There are a large number of companies on the Internet that offer free paper trading; a simple Google search will give you more choices that you can imagine. These companies offer this service in hopes that after you get comfortable paper trading futures, you will open a commodity account with them. In the meantime, once you have registered simply follow the directions of the commodity trading software and you are ready to begin.
What You Might Notice
If you put the cart before the horse and try to implement positions before you understand futures trading, you will be in for a surprise. The language of futures trading is different; there is terminology you need to learn, strategies that you won’t understand and even the trading software will probably be confusing. So before you try to begin commodities trading, go back to school and learn the terms, learn the techniques and learn the software where you are paper trading futures.
Is Paper Trading Futures Important?
In and of itself, paper trading futures is not important; it is merely a simulation of the things required to trade futures in the real world. What is important while paper trading futures is the approach you take; if you treat this like a game or don’t understand the importance of learning futures trading, you should seriously reconsider attempting to trade futures. This is a skill and the consequence is losing your money so don’t take paper trading futures lightly.
Conclusion
It is difficult to find another business opportunity where you can practice and learn for free. Take advantage of this unique opportunity and start paper trading futures today.
![]()
![]()
They say a journey of a thousand miles begins with the first step. This is true of futures trading for beginners as well. Even if you have investment experience you might not know the difference between stock trading and futures. Don’t get worried because that is the reason for this discussion. What is going to happen is that we will look at futures trading for beginners and give you some of the basics to get you started. If you have never been exposed to futures trading, it’s OK; the journey may be a thousand miles but we will take the first step together.
What Are Futures?
Futures trading is different from investing in the stock market or bonds since you don’t actually own anything. In futures trading, you are speculating on the future direction of the price in the commodity you are trading. This is different for beginners in futures trading; it is like a bet on the future price direction. The terms “buy” and “sell” merely indicate the direction you expect future prices will take. He or she must only deposit sufficient capital with a brokerage firm to insure that he will be able to pay the losses if his trades lose money.
Futures trading is a sort of insurance plan for those who are trading and investing. A farmer may sell futures on his wheat crop if he thinks the price will go down before the harvest; conversely, a bread manufacturer may buy futures if they think the price of wheat is going to rise before the harvest. Regardless of the price movement, both are guaranteed their price. The final component of the equation is the investor in futures trading who looks for changes in the futures markets and seeks to gain advantages by buying or selling at a profit.
What Is The Potential of Futures Trading?
Trading futures has the potential to be an incredible profit maker. It is said that Richard Dennis, a famed commodities trader, was able to parlay $1,600 of borrowed money into $200 million over ten years. While his results are truly extraordinary, not everyone can expect the level of successful trading he achieved, there is good news for every investor; you can make money in futures trading. You may only be a beginner trading futures, but you are savvy enough to recognize the potential in futures trading.
What Are Futures Markets?
The beginner in futures trading needs to understand that futures are not trading on the stock market. Some of the locations are well known like the Chicago Board of Trade, the New York Mercantile, the New York Cotton Exchange and the Chicago Mercantile Exchange. Some of the better known futures markets are:
What Do You Need To Do To Get Started?
There are several things you need to do as a beginner in futures trading:
Conclusion
Futures trading for beginners is nothing more than learning, defining your processes and sticking to your trading plan. This journey is no longer a thousand miles for you; you’ve already taken the first step so keep moving toward you goal!
Right-click on the link below and save target to your desktop, or to a file onto your computer. Once on your own computer, the recording may be opened with Windows Media Player, or QuickTime Player.
Stock Chat – Thursday 07/27/2011
Special presentation by Stephen Bigalow on Introduction to Trading Commodities
includes limited time offer on discounted Commodity Training Tutorials.
![]()
Selecting an options trading advisor is an important step in preparing to trade options. Before we break down the different types of accounts, let’s talk with the beginners first. If you have experience investing in the stock market, you probably already know that you can trade options with you current account.
Selecting An Options Trading Advisor
For the beginner, this is a very important step. In fact, selecting an options trading advisor and creating a stock trading plan are the two most important things you can do prior to entering the market. The critical factors in selecting an options trading advisor are:
What Are The Different Types of Accounts?
Trading accounts vary based of level of service, cost and available resources. The list below will give you an idea of the different types of accounts available:
Conclusion
Along with the trading rules in your stock trading plan, selecting an options trading advisor and trading account will likely be your most important decisions in the stock market. Analyze your personal approach and tendencies and select your options trading advisor based on your needs.
| 2011 Stock Market Holidays | Date |
| Martin Luther King, Jr. Day | January 17,2011 |
| Washington’s Birthday/Presidents’ Day | February 21,2011 |
| Good Friday | April 22,2011 |
| Memorial Day | May 30,2011 |
| Independence Day | July 4, 2011 |
| Labor Day | September 5, 2011 |
| Thanksgiving Day** | November 24, 2011 |
| Christmas | December 26, 2011 |
| **The NYSE Trading Floor closes early (1PM ET) on Friday November 25,2011 (The day after thanksgiving) |
Remember, the professional money managers often vacation around scheduled exchange holidays.
They may also close positions several days before, causing lighter volume around the stock market holidays.
Unpublished Special – Not Found anywhere else in our website!
For a limited time we are offering an exceptional opportunity to receive a 2-Week Free Trial Membership to The Candlestick Forum.
To participate – simply send an email to Abraham@candlestickforum.com with the subject line: 2-Week Free Trial Membership. You will receive an email with full instructions to join as our Guest and access Free Downloads valued over $335 in educational tutorials! (no credit card information will be requested, you are our Guest)
Look at Membership Benefits with over $335 worth of immediate free downloads to
Trade with Candlestick Confidence
Japanese Candlestick charting dramatically increases the information conveyed to the visual analysis. Each candlestick trading formation or series of formations can clearly illustrate the change of investor sentiment. This process is not apparent in standard bar chart interpretation. Each candle formation has a unique name. Some have Japanese names, others have English names.
Single candles are often referred to as YIN and YANG lines. These terms are actually Chinese, but are used by Western analysts to account for opposites; in/out, up/down, and over/under. INN and YOH are the Japanese equivalents. YIN is bearish. YANG is bullish. There are nine basic YIN and YANG lines in Candlestick analysis. These are expanded to fifteen to cover all possibilities clearly. The combination of most patterns can be reduced to one of these candlestick patterns.
Long days
A long day represents a large price move from open to close when candlestick charting. Long represents the length of the candle body. What qualifies a candle body to be considered long? That is a question that has to be answered relative to the chart being analyzed. The recent price action of a stock will determine whether a “long” candle has been formed. Analysis of the previous two or three weeks of trading should be a current representative sample of the price action.
Short Days
Short days can be interpreted by the same analytical process of the long candles on candlestick charts. There are a large percentage of the trading days that do not fall into either of these two categories.
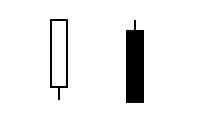
Maruboza
In Japanese chart analysis, Marubozu means close cropped or close-cut. Bald or Shaven Head are more commonly used in candlestick analysis. It’s meaning reflects the fact that there are no shadows extending from either end of the body.
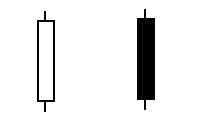
White Maruboza
The White Marubozu is a long white body with no shadows on either end. This is an extremely strong pattern used in stock analysis. Consider how it is formed. It opens on the low and immediately heads up. It continues upward until it closes, on its high. Counter to the Black Marubozu, it is often the first part of a bullish continuation pattern or bearish reversal pattern. It is called a Major Yang or Marubozu of Yang.

Black Marubozu
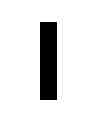
A long black body with no shadows at either end used in Japanese Candlesticks is known as a Black Marubozu. It is considered a weak indicator. It is often identified in a bearish continuation or bullish reversal pattern, especially if it occurs during a downtrend. A long black candle could represent the final sell off, making it an “alert” to a bullish reversal setting up. The Japanese often call it the Major Yin or Marubozu of Yin.
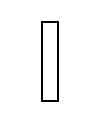
Closing Marubozu
A Closing Marubozu has no shadow at it’s closing end. A white body will not have a shadow at the top. A black body will not have a shadow at the bottom. In both cases, these are strong signals corresponding to the direction that they each represent.
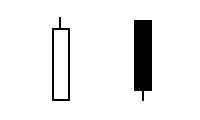
Opening Marubozu
The Opening Marubozu has no shadows extending from the open price end of the body. A white body would not have a shadow at the bottom end , the black candle would not have a shadow at it’s top end. Though these are strong signals, they are not as strong as the Closing Marubozu.
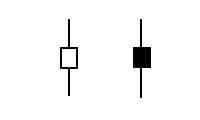
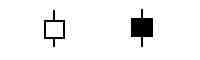
Spinning Top
Spinning Tops are depicted with small bodies relative to the shadows. This demonstrates some indecision on the part of the bulls and the bears. They are considered neutral when trading in a sideways market. However, in a trending or oscillating market, a relatively good rule of thumb is that the next days trading will probably move in the direction of the opening price. The size of the shadow is not as important as the size of the body for forming a Spinning Top.
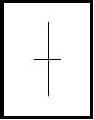
Doji
The Doji is one of the most important signals in candlestick analysis. It is formed when the open and the close are the same or very near the same. The lengths of the shadows can vary. The longer the shadows are, the more significance the Doji becomes. More will be explained about the Doji in the next few pages. ALWAYS pay attention to the Doji.
The dimension of knowing what the formations signify magnifies the potential for profits. The bodies, unlike the bars of bar charts, reveal an immense amount of information.
On to Candlestick Research Go To Products on Trading Candlestick Patterns