Archives for September 2019

Trading Commodities Online

Trading commodities online has gained popularity for many investors in recent years. Not only are trades executed quicker than when using a real live broker, but commissions are lower as well. While there are many benefits to trading commodities online, investors must also be aware of the hidden dangers with using this method. Both the advantages and disadvantages of trading commodities without the use of a full-service broker will be discussed in today’s article.

Online commodities trading does provide lower commissions than if going through a live full-service commodities broker making it more cost effective to practice multiple strategies at once. Traders are able to practice more sophisticated trades by potentially cutting the cost by about one hundred dollars per trade! For example, commodity trading can be done for fewer than ten dollars per round-turn with most online brokers.

Trading commodities online also allows instant trading without having to contact a live broker to place your orders. Almost everything you could possibly need to trade commodities is available through an online commodity trading account including commodity trading charts, commodity news, and technical analysis programs.

Commodity investing online also has its disadvantages that investors should be forewarned about. There is the potential to overtrade and this has become an increasing problem with the increased use of online trading. Due to the ease of which one can place trades online, this has led to undisciplined and impulsive trading. Additionally, due to lower commission rates, inexperienced investors will get often place trades that they normally wouldn’t, quickly finding themselves in a financial predicament. For some investors, the ease of trading leads to a false feeling of control and independence.

Trading commodities online is also dangerous for new investors who may need a mentor. Online brokers are often discount brokers that do not provide any advice to the new investor, but merely places the trades requested of them. This is great for investors who know what they are doing, and have achieved success in the commodities markets, but for the new investor, it may not be such a great thing. Many new traders make foolish mistakes that they wouldn’t have otherwise made if they had the assistance of a full-service broker. Many feel that the education received from a live broker is well worth the cost for new investors. Live broker offer more value to newer investors than they do to more experienced investors. Many investors suggest starting off with a full-service broker until you attaint the level of knowledge and discipline required to trade successfully. Regardless of which type of broker you decide to utilize, it is imperative that you at least have a mentor to which you can learn from and go to for help.

Many commodities brokers will give you a free trial period in order to test their services. Choosing your commodity broker is one of the most important decisions that you will make in your trading career, so be sure that you do your research. Finding a reputable broker that not only meets your needs but that compensates for your shortcomings will lead you to successful trading when trading commodities online.


Market Direction

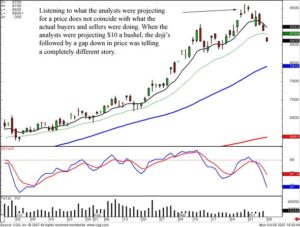
When do people sell? They panic sell at the bottom! The identification of the Dumpling Top pattern allowed for being in the right strategy at the right time. Knowing the results that should occur after a candlestick pattern allows an investor to take advantage of big price moves. That can occur in two different methods. As the market was selling off, having funds in short positions produced significant profits. For those that do not like to go short, sitting in cash was the proper strategy. Sitting in cash has a powerful outcome when used properly. Knowing that the markets are in a severe decline has an obvious ramification. There is panic selling coming into this market. That is probably enhanced with margin calls. The basic premise of candlestick analysis is having a graphic depiction of what is going on in investor sentiment. The charts will show when panic selling is occurring. That has been witnessed for the past three trading days as this downtrend accelerates. There are also some simple signs for when the bottom has finally arrived.

Trading Commodities Online, Dow Example 

DOW

The futures continued to trade lower after the close today. This was after the Dow was down almost 700 points. The NASDAQ clearly negated the Inverted Hammer signal with a 95 point drop. What would indicate final capitulation? A gap down on the open tomorrow. A simple rule of thumb, when you see a gap down in an oversold condition, start watching for a Candlestick buy signal. Which stocks should be bought when a potential reversal is in the making? There are simple scanning techniques that show which stocks are experiencing bullish participation even with the market plunging. The visual analysis of this relative strength allows investors to be prepared to enter stock positions that have good upside potential when the reversal occurs.
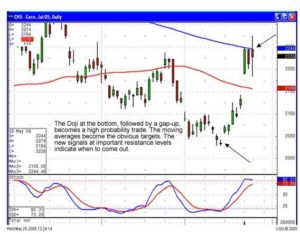
Trading Commodities Online, CNH Example

CNH

What type of reversal usually occurs after a severe market plunge? A very strong upsurge! Why? Because when it becomes obvious to the smart money that the markets are severely oversold, the funds that have been accumulated from selling at higher levels are waiting for  the capitulation day.

This is where huge profits can be made. Look for a gap down. If that occurs and the selling continues, go to your one minute and five-minute charts and start watching to see when the ‘churning’ begins. The candlestick signals will appear when the buyers and sellers finally find a level where they have reached equilibrium. Repeat – this is where huge profits can be made. Once the buyers see that a bottom has been made, the panic buying will start. This can produce rates of return of 20%, 40%, 100% in just a very short period of time. Watch for candlestick reversal signals or the preparation of a candlestick signals set up.

Chat room tonight – 8 PM ET- everybody is welcomeClick here for instructions. This is where scanning for the possible high profit trades becomes immensely important. The stocks that are getting obliterated because of margin calls and panic selling will be the ones that drop dramatically fast and come back up dramatically fast.

Good investing,

The Candlestick Forum Team


This Week’s Special

Trend Analysis 25% OFF at Checkout

Candlestick Precision

Subscriber Special – Only 10 sets remaining
Trading with the Confidence of Candlesticks

Click here for details.

Website special reflects current newsletter. If you are reading an archived newsletter you will be directed to Current Website Special.

Commodity Price Trends

The ability to predict commodity price trends has made a number of traders rich. There are two ways to predict commodity price trends; they are by fundamental and technical analysis of the commodities involved. Analysis and prediction of longer term commodity trends requires a basic knowledge of each commodity traded and attention to the details that affect commodity prices. It comes down to long term trading supply and demand. Technical analysis for short term trading of commodities relies upon the fact that commodity price patterns repeat themselves. It is the nature of any equity market to come to a consensus with time. However, in doing so, the path is seldom straight. Commodities markets fluctuate up and down in establishing commodity price trends. Commodity prices also fluctuate in predictable ways before a market reversal. Learning to trade both long term and short term factors is a key to commodity trading success. Starting with Commodity and Futures Training the beginning trader will establish the basis for years of successful commodities trading.

It has been hundreds of years since rice traders in Japan as well as tulip bulb traders in Holland started making sense of commodity price trends. Traders kept records of price patterns and did the first types of trend analysis. They were able to understand that before entering into a price trend a commodity would go through a number of price patterns that were repetitive and highly predictive. Candlestick analysis of Candlestick pattern formations led to successful Candlestick trading tactics that made traders rich in the days of the Samurai. These technical analysis tools are still used and still effective today in predicting commodity price trends as well as breakouts from trends. Traders need to understand market fundamentals in order to understand the potential range in which a commodity will trade and its likely eventual price. The trader who is trading oil futures , corn futures, gold futures, or virtually any futures will need to understand a different set of fundamentals but the mechanics of the commodities markets and how traders trade are the same in each of these arenas. Learning the basics of technical trading, Candlestick basics, will allow the trader to stay a step ahead by letting the market say what the market will do.

During commodity price trends the prices of commodities or commodities futures will not move up or down in a straight line. Those mostly interested in long term investing in a given commodity will typically buy or sells futures contracts based upon their analysis of the price trend. They will wait until the trend plays itself out or the contract is ready to expire before exiting the trader. A day trader with a shorter term focus will typically buy and sell futures contracts during the course of the trends, using trend analysis to guide their purchases and sales.

By following commodity price trends traders can profit from both their fundamental analysis of commodity supply and demand aspects and from their technical commodity analysis of shorter term market moves within the prevalent trend.


Market Direction

Candlestick signals make for a very simple if/then analysis. The Dow came up to the 50 day moving average last week and formed a couple Doji’s. This produced a simple analysis. We know the trend will move in the direction of how they open prices after a Doji. Friday required a positive open to indicate the bullish trend was still in progress. This would also have indicated the 50 day moving average would not be acting as resistance. However, the pre-market futures on Friday morning showed weakness in the markets. A weak open provided a new set of information. The 50 day moving average was continuing to act as resistance. The down-trending channel was still in progress. Stochastics in the overbought condition, starting to roll over, was additional confirmation the uptrend was failing and it was time to go short.

DOW

Having the visual analytical tools to apply, along with the candlestick signal, makes trend analysis very easy. The lower open on Friday made was an immediate instigation to close out any long positions that were looking weak and establishing short positions/short funds. Knowing what the trend would probably do upon a lower open allowed for closing positions immediately. This eliminates the emotional questioning most investors get involved with when they do not take action on a position at the appropriate time. It is not uncommon for a price to open lower and then continue lower with an investor thinking, “why did I not close that on the open like I should have?” The next thought process is waiting to see if there is going to be another bounce up so the position can be closed out at a better price. That thought process continues as the price keeps going lower. Or the price does bounce back up and the thought process now becomes to hold the position because it may be going back up. Candlestick signals have specific results based upon how they open and move. Knowing what should be done at the appropriate time allows for much more decisive and profitable trading.

BAC

Private training sessions – “Why would I need to do a private training session if I have already done the basic training and the boot camp?” This is a very good question! A private training session has different dynamics than an online webinar or a live seminar with 20 or 30 people. The questions you have in your mind are probably not going to be asked under those conditions. That means any additional information you receive from the point where you are unsure of something does not have a concrete effect of learning the trading process. You will not see charts that are any different during the private training session then you would during an online training webinar. However, what ever aspect of the chart analysis that was not fully clear in your mind will be addressed until you understand it completely. When you finish a private session training, you will understand candlestick analysis completely. That creates a completely different perspective for future trading. You now can go forward knowing that you have learned and understood candlestick analysis to the fullest extent. From that point, you will not be making trade decisions with the idea you are still learning and gaining experience, you will be investing based upon knowing all the aspects found in candlestick signals and trying to improve upon them.

You will gain a different perspective when all your questions about investing become fully clarified. You can now move forward with the idea that you want to improve the trading system to fit your investment style andn nature. Learning how to invest correctly is not merely reading books and watching chart analysis. Profitable investing involves knowing in your own mind that you have all the knowledge about a trading system. From there, each investor can produce the trading strategy with confidence, the confidence required to execute trades at the appropriate times without second-guessing. If you have a good understanding of candlestick signals and they’re confirming indicators, but you are still not making the big profits you have expected, you need to dig into your own psyche and discover what is holding you back. The Candlestick Forums Private Training Sessions are designed to obtain the full comprehension of the common sense aspects of candlestick analysis.

Click here for private training session information.
Chat session tonight 8 PM ET
Good Investing,
The Candlestick Forum Team


Private Training Sessions with Stephen Bigalow

now scheduling for August 27, 28, and 29 in New York

Current Website Specials

Click here for details

Website special reflects current newsletter. If you are reading an archived newsletter you will be directed to Current Website Special.

Commodity Trading System – A Candlestick Signal Forte

Utilizing Candlestick signals can help an investor develop a highly profitable commodity trading system. Japanese rice traders used the signals to develop the first commodity trading system. The Honshu family successfully traded the rice markets centuries ago.

Commodities are easier to trade than stocks using Candlestick signals. The reason is simple. There are fewer outside influences to affect commodity prices. A successful commodity trading system can be implemented through simple visual analysis.

The signals used in conjunction with simple confirming indicators such as stochastics produce a high probability commodity trading system. As illustrated in the July Wheat chart, when the price of Wheat was an oversold condition, a Bullish Harami illustrated the time to buy.

The trend of a commodity will usually remain steady in one direction until the stochastics indicate an extreme condition, either overbought or oversold. Applying Candlestick signals to the trend analysis in these extreme conditions makes for a very simple commodity trading system. The probabilities become highly in the favor of the Candlestick investor.

Note how July Wheat started its uptrend when the stochastics were in the oversold condition. A Bullish Harami/Spinning Top was the reversal signal at the bottom. July Wheat now is approaching the overbought area. The indecision, Spinning Tops and Doji’s, indicate less conviction to the upside. A Bearish Engulfing signal today should signify that the uptrend.

Commodity Trading System Wheat

Wheat

The Candlestick signals make for a high profit commodity trading system because of the immense amount of investment information provided in each of the signals. Prices move based on investor sentiment. Use this information to your advantage. The 12 major signals can make trading commodities extremely profitable.
 
Commodity Trading Platforms
Commodity trading platforms are a necessity. The extreme leverage used in commodity trading definitely requires a basis for buying and selling. One of the most proven commodity trading platforms is Candlestick signals. Candlestick analysis was developed through hundreds of years of trading rice.

The 12 major signals that are very effective for trading stocks become more effective when trading commodities. Commodity trends have one basic advantage over stock trends. Once a commodity trend is identified, the trend will persist in much better identifiable moves than a stock price. The reason for this is that commodities usually have much fewer outside influences than a stock price. A commodity price usually moves based on supply and demand. A stock price will move based on changes in fundamental elements, the stock market direction in general, interest rate moves, or a multitude of other influences that can change investor sentiment.

Being able to identify strong reversal patterns using Candlestick signals is one of the best commodity trading platforms available. Commodities usually move based on supply and demand. Those influences have a minimal number of aspects. Grains and the soft commodities can be affected by weather. Currencies can be affected by each other. The dollar will usually act inversely to the British pound, the Eurodollar, and the Swiss franc.

Highly profitable commodity trading platforms can be developed when you have Candlestick signals illustrating definite reversals in trends. As illustrated in the July Corn contract, a Doji at the bottom followed by a gap-up, when stochastics were in the oversold condition, made for a high probability, profitable trade. Being able to identify the obvious reversal signals allows the Candlestick investor to take advantage of entering trades at the optimal prices.

Commodity Trading System Corn

Corn

The centuries of identifying high profit reversal signals are built into Candlestick formations. Use this information to your advantage. Whether trading stocks or commodities, the signals put the probabilities highly in the investor’s favor. Very simple and profitable commodity trading platforms can be established. If you find a trading format that works successfully, then it is better to use it on a trading entity where you can leverage your high probability success ratio.


Commodity Trading Package

Candlestick Patterns Provide Excellent Stock Market Trading Tools

When deciding on which stock market trading tools to use for trading your own portfolio – Nothing beats Candlestick Signals! Stock charts displayed in bar chart formats are difficult to interpret and frustrating to investors new to the stock market. Even if you are unfamiliar with reading stock charts, Candlestick Charts provide  clear and easy to identify patterns. Reading about the Japanese Candlestick signals is interesting and it aids in remembering profitable pattern setups. The Candlestick Forum presents stock market trading tools that help investors read stock charts and recognize dependable trading patterns.  These patterns produce predictable results which are easily combined with other technical analysis tools.  Stock market trading tools do not have to be difficult, especially if you begin with Candlestick Charts.

Three Inside Up and Three Inside Down
 
Three Inside Up and Three Inside Down

Description

Note that after the long candle day that is in the same direction of the trend that the Harami pattern occurs.  The Harami is the first indication that the trend has stopped. The third day confirms that the harami has indicated correctly. The three-day pattern is a modern era confirmation of the Harami pattern.
 
Criteria

  1. The Harami pattern is the overriding signal component of this pattern.
  2. The harami body should be the opposite color of the long candle day.
  3. Day three has a close that is higher than the open of day one.(Three Inside Up) Or lower than day one in the bearish indication.(Three Inside Down)

Pattern Psychology

After a trend and the occurrence of a long body day that extends that thread, the harami pattern shows that the trend has stopped. A factor that helps identify the strength of the reversal is how big the harami is compared to the previous day’s body. A body that is relatively large indicates more strength in the opposite direction. Additionally, the magnitude of the strength in day three adds to the potency of the reversal.
 
Training Tutorial
Candlestickforum Flash Cards  These unique Flash Cards will allow you to be “trading like the Pro’s” in no time.

Return to Candlestick Explanation for Secondary Signals

Commodity Market History

Knowing commodity market history allows us to know what the commodities markets will do next. Whether you are buying stock, trading options, selling futures, or trading commodities, knowledge of market history is essential. Trading software has market history built into its programs. Thus commodity traders who are trading online can do simulation trading with real commodity market conditions. More to the point keeping track of commodity market history goes back as far as when  were new. Traders kept track of what happened when certain Candlestick chart formations developed. The use of technical analysis tools such as Candlestick charting allows traders to predict market moves using market history. A good way to learn to use technical analysis based on commodity market history to your advantage is to take commodity and futures training.

The reason traders keep track of commodity market history is that this history repeats itself. Thus patterns, such as Candlestick pattern formations, are predictive of continuing market trends or market reversal. Although a trader may be steeped in fundamental analysis of a commodity he or she still needs to be attuned to technical analysis indicators because these predict the actions of large groups of traders in live market conditions. There really is a déjà vu character to what is essentially trading using commodity market history as a guide. When true market history is packaged and schematized the trader should not forget that those neat little figures on the chart are really representations of many trading sessions in many commodities. They are predictors of how real traders, in groups, will react to market conditions and to each other to create the next state of trading in commodities.

In trading commodities you can buy and sell futures on everything from gold and copper to live cattle or interest rates. You can also trade options. The distillation of commodity market history in Candlestick chart patterns will help with selling putsselling callsbuying puts, and buying calls on commodities futures just as much as it helps trading futures directly. The presence of a sufficient number of traders in a sufficiently volatile market will end up creating patterns as traders react to fundamentals of the market as to each other’s trades. Although each trader will do fundamental commodity analysis as well as analysis of technical factors, the fact that one trade is entered at a time changes the market ever so slightly with each trade. Thus all traders minus one are confronted with a slightly different situation. As trades are executed the market changes, traders reevaluate, change tactics, and patterns develop.

The wise trader will always use trading analysis tools and be mindful of the fact that history continually repeats itself on a commodities exchange. It is this realization that every day creates market history and that history repeats itself in the form of recognizable price patterns that gives the wise trader an advantage. This is what Japanese rice traders realized centuries ago. The use of Candlestick charting techniques gave these traders an edge on those who only looked at market fundamentals.


Market Direction

Today’s whipsaw action in the market was partly due to the heavy selling that was actually occurring but then an electronic anomaly set in. Probably the lower 400 or 500 points in the Dow was a result of electronic trading. The New York Stock Exchange has the discretion of stopping trading in individual stocks that are getting overloaded for anywhere from 30 seconds to 90 seconds. However, the rest of the electronic exchanges are still active but if they are thinly traded exchanges, an electronic sell order trying to find the best bid price may hit one of these secondary markets at much lower prices.

Commodity History, Dow Example

DOW

Whatever the conditions, the candlestick signals were indicating selling was on its way. The sell signals last week at the tee line indicated a definite change of investor sentiment. The whipsaw trading of last week was an indication a severe change of investor sentiment was occurring. The Dow and the NASDAQ had the possibility of supporting at the 50 day moving average today but continued weakness breach that level with great enthusiasm. As the selling continued, panic selling started to set in. Although the Dow being down 900+ points was probably not a true indication of where the markets should be trading, the 347 point move in the Dow was still relatively substantial. This was what the bearish signals revealed last week. A bearish pull back was in the making.

Obviously there would not be any feelings of anxiety you were situated correctly in the market. There is a great sense of pleasure being short when the market is heading down. It is a Double Mint pleasure. First, it feels very good to watch the profits grow as prices are going down. Secondly, it feels that much better knowing the pain of what it feels like to be long when prices are going down and you are not having to experience it. Most investors are optimists. They want the market to go up. That is only human nature. When prices are going up, everything seems to be improving. It is harder to make money when the market is moving down. A large percentage of investors do not like or understand shorting stocks. Buying the short funds seems to be a comfortable alternative.

Commodity History, BGZ

BGZ Short Fund

Candlestick analysis provides the investor with the tools they need. Candlestick signals show the direction of the market in general. That analysis can be continued to individual sectors, then on to individual stocks. This is the alignment of the stars. The information built into the candlestick signals allows investors to participate on the correct side of the market. What would have been an anguish filled day for most investors was an exuberant, highly profitable day for the candlestick investor.

Commodity traders

A two day training program is now scheduled for May 22 and May 23. You will learn numerous techniques to take advantage of what candlestick signals reveal for intraday trading and swing trading of commodities and currencies. This two day online training program will expose you to an immense amount of profitable information. Commodity trading using candlestick signals can be extremely profitable. What is considered a high risk trading venue now becomes a high profit venue. There are many advantages to trading commodities. If you are a true traitor, you can be trading stocks at the beginning and the end of each day while trading commodities during the slow middle part of the day. Spaces will be limited. Look for details on the home page over the weekend.

Chat session tonight at 8 PM ET – learn how to have made huge profits on days like today.

Good Investing,

The Candlestick Forum Team


This Week’s Special

Projecting Price Targets – Quickly learn to spot the most profitable price targets! – BONUS EBOOK with purchase!!!

Click here for details

Website special reflects current newsletter. If you are reading an archived newsletter you will be directed to Current Website Special.

Understanding Candlestick Patterns

The Major Japanese Candlestick Patterns

There are really only 12 major Candlestick patterns that need to be committed to memory. The Japanese Candlestick trading signals consist of approximately 40 reversal and continuation patterns. All have credible probabilities of indicating correct future direction of a price move. The following dozen signals illustrate the major signals. The definition of “major” has two functions. Major in the sense that they occur in price movements often enough to be beneficial in producing a ready supply of profitable trades as well as clearly indicating price reversals with strength enough to warrant placing trades.

Utilizing just the major Japanese Candlesticks trading signals will provide more than enough trade situations for most investors. They are the signals that investors should contribute most of their time and effort. However, this does not mean that the remaining patterns should not be considered. Those signals are extremely effective for producing profits. Reality demonstrates that some of them occur very rarely. Other formations, although they reveal high potential reversals, may not be considered as strong a signal as the major signals. Learn these signals to find the best stock picks.

Stock Investing Basics of Japanese Candlesticks

Candlestick trading analysis does not require knowing intricate formulas or ratios. Candlestick stock analysis does not require massive amounts of education to effectively utilize the signals. The stock investing basics of Japanese Candlesticks result in clear and easy to identify patterns that demonstrate highly accurate turns in investor sentiment. The average investor does not have to be dependent on the investment professional, a professional whose recommendation does not always have your interest at the forefront. Whether totally unfamiliar with investment concepts or very sophisticated in investment experience, the Japanese Candlestick trading formations are easily utilized. The signals and patterns are easy to see.


Major Signals Educational Package

Act Today and receive Over 8 hours of video tutorials on The 12 Major Signals for only $12.00

(retails in our site for over $500)

Limited One Time Offer for a small $12 processing fee!

PLUS – 30-day Free Trial Membership if ordered today


Candlestick Chart Illustrations

Japanese Candlestick charting dramatically increases the information conveyed to the visual analysis. Each candlestick trading formation or series of formations can clearly illustrate the change of investor sentiment. This process is not apparent in standard bar chart interpretation. Each candle formation has a unique name. Some have Japanese names, others have English names. Where possible the English name and Japanese name will be given. The Japanese names will be done in Romanji writing so that English speaking people can say the names.

Single candles are often referred to as YIN and YANG lines. These terms are actually Chinese, but are used by Western analysts to account for opposites; in/out, up/down, and over/under. INN and YOH are the Japanese equivalents. YIN is bearish. YANG is bullish. There are nine basic YIN and YANG lines in Candlestick analysis. These are expanded to fifteen to cover all possibilities clearly. The combination of most patterns can be reduced to one of these patterns.

Candlestick Images and Explanations – Candlestick Signals with Illustrations, pattern psychology and recognition.

Understanding Stock Market Movement

Given enough time investing in the stock market, a trader will tell you that the research and analysis require the most time. In order to be successful, an investor needs to understand how the markets move and how to interpret differences in the various market indexes and what they mean. This kind of evaluation becomes an important part of an investor’s technical analysis of the stock market. It can add further clarity to various stock market movements and help an investor to find potential trades.

Let’s start this review by looking at each of the big three market indexes:

  • S&P 500 – This market index is most commonly used by professionals in the financial world because it includes such a large sector of the market. It includes 500 of the most widely traded stocks and because it is a market cap weighted index, changes in larger companies tend to reflect more strongly than small cap stocks. The S&P 500 tends to be a more accurate indicator of market movements than the Dow.
  • The NASDAQ Stock Market Composite – Even though this market index includes all of the stocks that are listed on the NASDAQ market, it is historically weighted toward technology stocks. This condition is the result of the fact that it is a market cap weighted index and thus the large cap stocks of technology companies strongly influence this index.
  • The Dow Jones Industrial Average – This is the old-timer of the bunch. The Dow is the oldest, most widely known and most quoted of all the market indexes. The Dow tracks 30 of the most influential companies in the US and because it represents only large companies, it misses out on the small and mid-size companies completely. Unlike the S&P 500 and the NASDAQ, the Dow is a price weighted market index which means that if a stock price changes by $1, the effect on the market index is the same no matter the price of the stock. The Dow reflects only about 25% of the total market but changes in the Dow tend to reflect consumer confidence in the stock market as a whole.

What perspective does each index take?

Because each of the indexes takes a different approach, the stock market movement for each is different. For example, the NASDAQ structured so that technology stocks enjoy greater prominence that those in other stock sectors. This was evident in the late 1990’s when the technology boom was taking place. As events unfold that effect the technology sector, the NASDAQ will tend to see the most dramatic stock market movement, although the Dow will also be significantly affected.

The S&P 500, on the other hand, is not as severely impacted by tech stocks but tends to have a stock market movement that more accurately reflects the market in its entirety. Because it is weighted to the larger stocks it does not have the violent reaction to Wall Street news that its small-cap stocks might cause. The overall balance of the S&P 500 causes a more accurate representation of market movement than the Dow. This is the reason that most financial professionals use it as their barometer for stock market movement.

The Dow is the interesting one of the bunch; the granddaddy of the market indexes, it looks only to the 30 most influential stocks for its analysis of market movements. These are all large-cap stocks so they do not accurately evaluate the entire market, yet the Dow has proven to be the best market index for indicating consumer confidence.

Conclusion

No one index gives you the entire picture of stock market movements. The combination of the three can help you draw better conclusions about the market movements and what is motivating them. Activity by the tech sector will appear with strong reactions by the NASDAQ. Strong movements by the Dow can indicate whether the consumers are feeling good about the market in general. The Dow, though weighted to the top, will be a better indication of the overall stock market movement. By considering all three, successful traders can locate where highs and lows in stock market movement can be found and invest accordingly.

Stock Market Education

Successful investing in the stock market takes time and patience and most importantly requires a thorough stock market education. There are many different ways to trade stock and many valuable resources available to assist you, but without basic knowledge in the stock market, and how it works, you are far from a successful investing career.

The stock market is a private or public market for the trading of company stock and derivatives of company stock at an agreed upon price. The stocks are listed and traded on stock exchanges and the purpose of these exchanges is to facilitate the exchange of securities between buyers and sellers. There is no doubt that anyone can make money through trading and investing in the stock market, but stock market education and the right training is necessary to succeed.

When you decide to learn how to play the stock market game, you will first learn about two basic methods. These methods are referred to as technical analysis and fundamental analysis. Technical analysis studies price actions in the markets through the utilization of charts and techniques. The idea is to learn how to forecast price trends focusing only on price movements and not on the company’s financials. Fundamental analysis focuses on general economic conditions, business trends, and analysis of company filings and financial statements. Through obtaining a stock market education you will be able to determine which method you prefer so that you can trade stock efficiently. In addition to learning about fundamental and technical analysis you will also need to understand what it means to own stock. When you buy stock, you are actually paying for a small percentage of everything that the company owns. You are considered a shareholder or a stock holder and you own a small fraction of a corporation.

Your stock market education will also consist of an introduction to the various stock exchanges available for trading. The stock market in the United States includes the trading of securities that are listed on the New York Stock Exchange (NYSE), the NASDAQ, and the Amex. Only those stocks listed with each exchange may be traded and the purpose is to match buyers and sellers. The NASDAQ is completely electronic where all of the trading is completed over a computer network, unlike the NYSE that requires human contact and interaction to match buyers and sellers. You may also be introduced to the major European stock exchanges such as the Euronext, the London Stock Exchange, and the Deutsche Borse.

After obtaining a stock market education, the investor is required to establish a trading plan, method and the type of trading that they will participate in whether it is day trading or long term trading. Luckily there is something for every type of investor no matter how much money you have, and not matter how much time you have to devote to trading stock. The stock market is vital to our economy and is one of the most important sources for companies to raise money.  It allows business to go public or to raise additional capital in order to expand. Start to learn about the stock market today so that you can participate in expanding the global economy and make some money for yourself in the meantime.

Buy Straddle – Breakout Options Trading Strategy

In times when there is low stock volatility and a large, unpredictable breakout move is expected, a successful trader might consider making a straddle buy. A buy straddle is implemented by purchasing a call option and a put option on the same asset with the same strike price and expiration date. Because the stock is poised for a breakout but the direction isn’t known, buying a straddle can be an excellent stock market strategy.

A buy straddle affords the investor a limited investment risk, while offering an unlimited profit potential on a major move up or down. In such a strategy, the potential loss is limited to the premiums paid for the call and the put, as well as commissions. A major move in either direction allows the investor to sell the opposite option and ride the one making the money, thus creating a highly successful trading situation.

When technical analysis with Candlesticks indicates that a stock is trading in a triangle pattern, it is a prime target for a buy straddle. Frequently, with this type of trading pattern, an explosive move occurs near the tip of the triangle but the direction of the move is not readily known. Since the call and the put cover both directions of movement, a reward is quickly realized in this maneuver. Once the direction is known, the other option is liquidated and the investor can ride the trend. At this point, it is important not to ride the trend too long since time decay works against the trade in this position.

When buying a straddle, the put and the call that are purchased are either at-the-money or close to it. After identifying a triangle trading pattern with a tightening trading range, a position is initiated near the tip of the triangle. Because volatility is low, the options will be cheaper before a breakout occurs. Since this technique requires buying both a put and a call, buying before the spike is even more important. Straddle buying has excellent risk reward ratios since the actual risk is limited and the reward is potentially unlimited.

As with other stock option trading strategies there is risk, though limited, in a straddle buy. The actual purchase will be more costly since both a put and a call are being purchased on the same option. If the option fails to break out before the expiration date of the call and put, the trader will lose money on the purchases. Decay is also a factor working against a buy straddle, but it is eliminated by initiating a position before the breakout and quickly selling the option on the wrong side.

A buy straddle is an excellent tool to use in a stable market when stock market technical analysis indicates that a stock is ready to break out of a triangle trading pattern. In such a case, the trading range is very tight and the stock is likely to make an explosive move. Buy straddles create the potential for significant gains with limited risk of investment when investing in the stock market.


Return to main Options Trading Category

Recommended Option Training Materials

The Seven Deadly Sins of Option Trading – Free E-Book Download

Options 101Options 101 Text
Options Strategy SpotlightStrategy Spotlight Text