Stock Market Advice for Trading The Morning Star Signal

Stock market advice is plentiful over the internet. There is sage stock market advice like; Don’t try to time the market, use cost averaging, diversify, and limitless tid-bits but they do not teach you anything about trading. What good is stock market advice if you still don’t know how to read a stock chart? The Candlestick Forum provides practical stock market advice by continued “How To Trade” articles for identifying specific candlestick charts. This article will help you to identify The Morning Star signal and the trading criteria used for successful implementation. We hope these articles are helping you along your way to successful stock market trading. Be sure to join Stephen Bigalow live over the internet for his free Thursday evening Chat Sessions.

Morning Star

MORNING STAR

Description

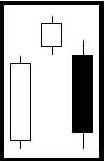
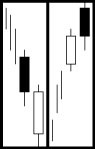
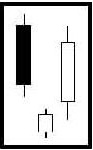
The Morning Star is a bottom reversal signal. Like the planet Mercury, the morning star, it foretells that brighter things – sunrise, is about to occur, or that prices are going to go higher. It is formed after an obvious downtrend. It is made by a long black body, usually one of the fear-induces days at the bottom of a long decline. The following day gaps down. However, the magnitude of the trading range remains small for the day. This is the star of the formation. The third day is a white candle day. And represents the fact that the bulls have now stepped in and seized control. The optimal Morning Star signal would have a gap before and after the star day.

The make up of the star, an indecision formation, can consist of a number of candle formations. The important factor is to witness the confirmation of the bulls taking over the next day. That candle should consist of a closing that is at least halfway up the black candle of two days prior.

Criteria

  1. The downtrend has been apparent.
  2. The body of the first candle is black, continuing the current trend. The second candle is an indecision formation.
  3. The third day shows evidence that the bulls have stepped in. That candle should close at least halfway up the black candle.

Signal Enhancements

  1. The longer the black candle and the white candle, the more forceful the reversal.
  2. The more indecision that the star day illustrates, the better probabilities that a reversal will occur.
  3. A Gap between the first day and the second day adds to the probability that a reversal is occurring.
  4. A gap before and after the star day is even more desirable.
  5. The magnitude, that the third day comes up into the black candle of the first day, indicates the strength of the reversal.

Pattern Psychology

A strong downtrend has been in effect. The sellers start getting panicky. There is a large sell-off day. The next day as the selling continues, bulls are stepping in at the low prices. If there is big volume during these days, it shows that the ownership has dramatically changed hands. The second day does not have a large trading range. The third day the bears start to lose conviction as the bull increase their buying. When the price starts moving back into the trading range of the first day, the sellers diminish and the buyers seize control.

Training Tutorial

The Morning Star & Evening Star Signals  This 56 minute video provides a clear understanding for trading and maximizing your profits.

Put Hedge – Bearish Options Trading Strategy

A Put Hedge is the stock option trading strategy of buying puts during a bearish market to protect stock shares that, while the trader is reluctant to sell, are vulnerable to a decline in the market. Successful traders utilize strategies such as Put Hedges to insulate their portfolios from loss in a bearish market. This method also has the potential of unlimited profits, while at the same time limiting the potential loss by the investor.

When a trader is utilizing portfolio diversification and feels that the portfolio is exposed to a market decline, it is possible for the investor to have several options available to create a Put Hedge. An excellent technique, if the trader feels his, or her, portfolio is sufficiently diversified, is to purchase index puts to protect the entire portfolio. To implement a Put Hedge, the investor needs to select an index that best represents his / her portfolio. If the trader has successfully utilized his / her stock trading system, such as Japanese Candlesticks, and identified a declining market, any losses incurred with the decline in assets will, in turn, be offset by the gains made as the value of the index puts, or Put Hedges, experience an increase.

In such a stock market strategy, the profit reward has the potential to be unlimited, since both the traders’ portfolio and Put Hedge could rise instead of fall. In this instance, the investor would make money on the portfolio and the index puts minus the cost of the premium paid for the puts. If the stock market technical analysis of the trader is correct and the market declines, the losses on the established portfolio will be limited because they will be offset by the gains realized on the Put Hedges that were purchased. These puts, in turn, have been successful and the investor has created a Put Hedge which protected the trader’s portfolio in a bear market.

When the market turns or the investor once again has confidence in its stability, he / she can sell the index puts if the retain any value, giving the trader another avenue of profit. If the market index puts have expired, the trader will need to determine an appropriate course of action. If the market has truly turned, the investor can simply do nothing, since he / she no longer needs a Put Hedge to protect the stock portfolio. If the market is still bearish and unstable, the trader will need to determine whether it is necessary to purchase an additional Put Hedge as protection against the stock market. If so, the method for this transaction will be identical to the original purchase.

As with any strategy in the stock market, it is important to analyze the expectations for the underlying asset and for the market before proceeding. Remembering that this practice occurs during a bearish market, the investor must realize that any strategy should be conservative and consistent with his / her stock trading plan. Whether using Put Hedges or buying out-of-the-money calls, it is important that the investor understands that the ultimate goal is to make money, as well as to protect the money already made.


Return to main Options Trading Category

Learning to Invest in the Stock Market Using the Bullish Engulfing Signal

Learning to invest in the stock market is a difficult process.  There are multitudes of sources that will give their opinions on how to invest.  For the person that is just learning to invest in the stock market, the massive amount of information can be overwhelming.  Becoming educated in investing should be narrowed down to one basic premise.  What investment programs should I utilize that fit my investment risk factors?  Learning to invest in the stock market not only includes finding an investment program that fits ones investment nature, but also finding a program that produces the  results an investor expects.

Utilizing candlestick signals makes learning to invest in a stock market much easier to understand.  The 12 major signals found in candlestick analysis not only reveal high probability reversal situations but understanding the psychology that formed those signals makes understanding why reversals occur much easier to comprehend.  One of the fastest and easiest processes for learning to invest in the stock market is learning the candlestick signals. Each major signal provides an immense amount of information.

Bullish Engulfing signal is one of the major signals.  When the elements out of a Bullish Engulfing signal are broken down, an investor can clearly understand what was going on in investor sentiment to cause a reversal.  400 years of observations from Japanese Rice traders has recognized the Bullish Engulfing signal as a very high probability reversal signal.

Bullish Engulfing Pattern

BULLISH ENGULFING PATTERN
 
Description

The Engulfing pattern is a major reversal pattern comprised of two opposite colored bodies. The Bullish Engulfing Pattern  formed after a downtrend. It opens lower that the previous day’s close and closes higher than the previous day’s open. Thus, the white candle completely engulfs the previous day’s black candle.

Criteria

  1. The body of the second day completely engulfs the body of the first day. Shadows are not a consideration.
  2. Prices have been in a definable down trend, even if it has been short term.
  3. The body of the second candle is opposite color of the first candle, the first candle being the color of the previous trend. The exception to this rule is when the engulfed body is a doji or an extremely small body.

Signal Enhancements

  1. A large body engulfing a small body. The previous day shows the trend was running out of steam. The large body shows that the new direction has started with good force.
  2. When the engulfing pattern occurs after a fast move down, there will be less supply of stock to slow down the reversal  move. A fast  move makes a stock price over extended and increases the potential for profit taking.
  3. Large volume on the engulfing day increases the chances that a blowoff day has occurred.
  4. The engulfing body engulfs the body and the shadows of the previous day, the reversal has a greater probability of working.
  5. The greater the open gaps down from the previous close, the greater the probability of a strong reversal.

Pattern Psychology

After a downtrend has been in effect, the price opens lower than where it closed the previous day. Before the end of the day, the buyers have taken over and moved the price above where it opened the day before. The emotional psychology of the trend has now been altered.

Learning to Invest in the Stock Market, Bullish Engulfing Pattern

Futures Analysis – Reading the Future with Japanese Candlesticks


The name is definitely appropriate; futures analysis rests on being able predict future movements with a reasonable level of accuracy. For many people, bar charts are their tool of choice; it is familiar for sure but it leaves its users without valuable futures analysis information. When reading a commodity trading chart, the Japanese Candlestick signals provide users with a big advantage because they offer more information and predict trends that bar chart simply can’t.

The History of Japanese Candlesticks

Japanese Candlestick signals were invented around 1700 as a method of futures analysis and developed over the past few hundred years while trading rice. The Japanese Rice traders analyzed reoccurring signals on their commodity trading chart when trying to pinpoint the exact times to get in and get out of rice trading. Futures analysis with these signals made the Honshu family immensely wealthy. The signals they identified are as effective today in futures analysis as they were centuries ago.

Why Candlesticks Are So Powerful
Candlestick signals are the only trading system for futures analysis that considers human emotion. Emotions will always be the same; whether you are analyzing a stock trading chart or a commodity trading chart the same factors that have moved prices for centuries will still be in effect today. This is not any new; the human psyche is very predictable when it comes to investment decisions. Candlestick charts give a visual representation of the investor’s sentiment to futures analysis.

For futures analysis, a commodity trading chart will show a distinct advantage over a stock trading chart. The trends in a commodity trading chart will be more consistent, lasting for longer periods of time. The outside influences on a commodity are dramatically less than those found in a stock price. That can be used to an investor’s advantage when using futures analysis for a commodity trading chart.

You will find through futures analysis that most commodities have fewer elements to affect the supply and demand than do stocks. Grains and some of the soft commodities might have weather affect supply; in the currency trading, different currencies may be affected by each other. The British pound, the Eurodollar and the Swiss franc will usually trade the opposite direction of the US dollar.

The ability to analyze a commodity trading chart very quickly with Candlestick signals produces a huge advantage for being able to analyze what the equity markets would do. Crude Oil prices, the US dollar, Gold or any other commodity that could be affecting the direction of the equity markets can be seen and analyzed very efficiently using Candlestick signals.

There are 12 major candlestick signals that relate to trading commodities just as much as they do stocks; probably even more so! The bullish signals contained in them are just as powerful and effective as the bearish signals. Demonstrating when to get into a position is very important; however, what is more important is being able to analyze when to get out of a position. Commodity trading information comes to investors in different forms and different times; the analysis of that information can be interpreted dramatically different by investors. When the media creates euphoric buying at the top, it is hard for many investors to take profits. What if this is the position that is going to make the big money?  Should I be buying?  I don’t want to be selling with all this great Wall Street news around. Emotions such as there keep most investors from selling at the appropriate times.

In futures analysis, it is important to avoid reacting on emotions. This is the reason for having trading rules, a trading plan and following the signals you find with Candlesticks. Futures analysis with Japanese Candlesticks is a highly developed means of looking into the future.

Investing Stock Market Advice Using the Evening Star Candlestick Signal

So you want investing stock market advice and naturally you begin with a ‘Google’ search. But, this returns 56,700,000 pages for your review. Where do you begin? Do you really want to plow through all those pages and be bombarded with “buy this” or “register here for investing stock market advice”? Internet sites are a business, and we are no exception, but what happened to all the great ‘free’ material the internet is supposed to provide? The Candlestick forum continues it’s commitment to provide free stock market advice. We hope you are following our  ‘Candlestick Images and Explanations’. Each week we add another candlestick signal where we provide a graphic illustration of candlestick chart signals with descriptions for recognizing the candlestick signal, the trading criteria with signal enhancements and the pattern psychology behind the signal. We back up our promise to provide free stock market advice. Every Thursday evening Stephen Bigalow presents a live stock chat session over the internet. Absolutely FREE, no registration needed, come join us and you will find the investing stock market advice you have been looking for. Now for the free advice we promised.

EVENING STAR
( Sankawa Yoi No Myojyo )

Evening Star

Description

The Evening Star pattern is a top reversal signal. It is exactly the opposite of the Morning Star signal. Like the planet Venice , the evening star, it foretells that darkness is about to set or that prices are going to go lower. It is formed after an obvious uptrend. It is made by a long white body occurring at the end of an uptrend., usually when the confidence has finally built up. The following day gaps up, yet the trading range remains small for the day. Again, this is the star of the formation. The third day is a black candle day and represents the fact that the bears have now seized control. That candle should consist of a closing that is at least halfway down the white candle of two days prior. The optimal Evening Star signal would have a gap before and after the star day.

Criteria

  1. The uptrend has been apparent.
  2. The body of the first candle is white, continuing the current trend. The second candle is an indecision formation.
  3. The third day shows evidence that the bears have stepped in. That candle should close at least halfway down the white candle.

Signal Enhancements

  1. The longer the white candle and the black candle, the more forceful the reversal.
  2. The more indecision that the star day illustrates, the better probabilities that a reversal will occur.
  3. A gap between the first day and the second day adds to the probability that a reversal is occurring.
  4. A gap before and after the star day is even more desirable. The magnitude, that the third day comes down into the white candle of the first day, indicates the strength of the reversal.

Pattern Psychology

A strong uptrend has been in effect. The buyers can’t imagine anything going wrong, they are piling in. However, it has now reached the prices where sellers start taking profits or think the price is fairly valued. The next day all the buying is being met with the selling, causing for a small trading range. The bulls get concerned and the bears start taking over. The third day is a large sell off day. If there is big volume during these days, it shows that the ownership has dramatically changed hands. The change of direction is immediately seen in the color of the bodies.

Training Tutorial

The Morning Star & Evening Star Signals  This 56 minute video provides a clear understanding for trading and maximizing your profits.

Candlestick Forum Flash Cards   These unique Flash Cards will allow you to be “trading like the Pro’s” in no time.
 
We hope you found this article helpful and encourage you to sign-up for our free newsletter. (sign-up box at the lower left side of your screen) We do not share our newsletter database with anyone, ever! We do not flood you with daily advertisements. Our newsletter provides timely market observations provided completely free of charge or obligation

Return to Candlestick Explanation of the Major Signals

Buy Strangle – Breakout Options Trading Strategy

In times when there is low stock volatility and a large, unpredictable breakout move is expected, a successful trader might consider making a strangle buy. A strangle buy is implemented by purchasing a call option and a put option on the same asset with the same strike price and expiration date. Because the stock is poised for a breakout but the direction isn’t known, buying a strangle can be an excellent stock market strategy.

Buy Strangle affords the investor a limited investment risk, while offering an unlimited profit potential on a major move up or down. In such a strategy, the potential loss is limited to the premiums paid for the call and the put, as well as commissions. It is very similar to a Buy Straddle, except that the investor is purchasing options that are out of the money, which makes the potential loss smaller because the options are less expensive to purchase. A major move in either direction allows the investor to sell the opposite option and ride the one making the money, thus resulting in highly successful trading.

When technical analysis with Candlesticks indicates that a stock is trading in a triangle pattern, it is a prime target for a Buy Strangle. Frequently, with these types of stock chart patterns, an explosive move occurs near the tip of the triangle but the direction of the move is not readily known. Since the call and the put cover both directions of movement, a reward is quickly realized in this maneuver. Once the direction is known, the other option is liquidated and the investor can ride the trend. At this point, it is important not to ride the trend too long since time decay works against the trade in this position.

When Buying a Strangle, the put and the call options that are purchased are out-of-the-money. After identifying a triangle trading pattern with a tightening trading range, a position is initiated near the tip of the triangle. Because stock volatility is low, the options will be cheaper before a breakout occurs. Since this technique requires buying both a put and a call, buying before the spike is even more important. Strangle Buying has excellent risk reward ratios since the actual investment risk is limited and the reward is potentially unlimited.

As with all stock option trading strategies, there is risk, though limited, in a Strangle Buy. The actual purchase will be more costly since both a put and a call are being purchased on the same option. If the option fails to break out before the expiration date of the call and put, the trader will lose money on the purchases. Decay is also a factor working against a Buy Strangle, but it is eliminated by initiating a position before the breakout and quickly selling the option on the wrong side.

A Buy Strangle is an excellent tool to use in a stable market when technical analysis tools indicate that a stock is ready to break out of a triangle trading pattern. In such a case, the trading range is very tight and the stock is likely to make an explosive move. A Buy Strangles is one of several investment options that creates the potential for significant gains with limited risk of investment.


Return to main Options Trading Category

Candlestick Stock Chart Patterns Are the Most Reliable Method for Trading the Markets

Stock chart patterns have been utilized in the stock market for centuries. These recurring stock chart patterns create a huge advantage for technical investors by assisting them in identifying pattern trends. Depending upon the stock chart patterns, the pattern representation alerts traders to short term trend reversals, continuation patterns, market tops, false breakouts, and potentially explosive moves in price. Stock chart patterns continue to gain popularity in the trading community due to their ability to predict price movements. It is no surprise that many of the new stock market charting programs include search parameters identifying candlestick patterns. Serious investors recognize the value of candlestick stock chart patterns and benefit from the message each signal conveys. These  patterns reflect group behavior behind price movement and provide valuable insight.

Take the mystery out of stock chart patterns and learn to trade with Japanese Candlesticks. Each week we add a new article focusing on a specific candlestick pattern and unravel the secret behind upcoming price moves.

This week’s signal – Trading the Meeting Lines – A Candlestick Reversal Pattern.

Bearish Bullish Meeting Line

MEETING LINES
 
Description

Meeting Lines (or Counterattack Lines) are formed when opposite colored bodies have the same closing price. The first Candlestick body is the same color as the current trend. The second body is formed by a gap open in the same direction as the trend. However, by the close, it has come back to the previous day’s close. The Bullish Meeting Line has the same criteria as the Piercing Line except that is closes the same close as the previous day and not up into the body. Likewise, the Bearish Meeting Line is the same as the Dark Cloud pattern, but it does not close down into the body of the previous day.

Criteria

  1. The first candlestick body should continue the prevailing trend.
  2. The second candlestick gaps open continuing the trend.
  3. The real body of the second day closes at the close of the first day.
  4. The body of the second day is opposite color of the first day
  5. Both days should be long candle days.

Signal Enhancements

  1. The longer the bodies, the more significant the reversal pattern.

Pattern Psychology

After a strong trend has been in effect, the trend is further promoted by a long body day. The exuberance is increased the second day with a gap in the same direction. But before the end of the day, the price has come back to the same closing price of the previous day. This indicates that the other sid eof the market has now stepped in. Another day, opposite of the predominant trend is required to demonstrate that the trend has reversed. The opposite colored body does not need to be a long as the first body. In every case, a confirmation day is going to be needed. The pattern has more strength if there are no shadows at the meeting point.

Candlestick Forum Flash Cards   These unique Flash Cards will allow you to be “trading like the Pro’s” in no time.

Return to Candlestick Explanation for Secondary Signals

Options Trading With Candlestick Signals

Bullish Options Trading Strategies

Bearish Options Trading Strategies

Special Candlestick Breakout Options Trading Strategies

Neutral Options Trading Strategies

Options, the ultimate high risk investment vehicle. So it is thought by the vast majority. Why are options considered high risk? Simple. Most investors lose money in options. Statistics show that over 80% of all option trades lose money.

Why is this so? Because the odds are stacked against winning from the very start. First, as with all investments, but especially with options, the direction of price movement has to be correctly analyzed. This procedure alone is a major hurdle for the vast majority of investors. Next, the magnitude of the price move has to be correctly calculated; another procedure that has not been perfected by the average investor. On top of all that, add being correct as to the time element, the unaccounted aspect of most option analysis.

The combination of these three essential factors makes it extremely difficult to access an option trade correctly. And to add insult to injury, a premium is built into the option price. This premium reflects the speculative fervor of the market participants who think prices will move in their direction. The highly leveraged method of participating in the move creates a parasitic premium that is added to the true value of the option.

How do candlesticks turn un-advantageous probabilities into advantageous option trading profits? The essential factors of the signals can be applied to align the elements of successful option trades; signals, stochastics, market direction, etc. A few simple processes can be employed that will exploit the same factors that make other option investors lose money to put money into your pocket.

Direction

As you study candlestick signals, you will discover the improvement in accuracy will be quite noticeable. Under certain circumstances, the “accuracy” probability becomes extremely high. When all the essential indicators line up for a successful option trade, the signal showing strong buying in a stock, the stochastics below the 20 line, further confirmed by a bounce off a trend-line, and overall market direction, etc., an option trade can be executed. As in all the equations for producing a profit in an option trade, direction is the first consideration. Obviously, a clear and decisive signal is the reason for considering the trade in the first place. Knowledge of the reversal signals creates a huge advantage for exploiting short-term market moves. Especially profitable is the ability to pinpoint absolute bottom signals. Not only is there the benefit of purchasing an option at the ultimate lowest price, the premium or speculative fervor is also at its lowest point. This creates a double upside reward. As the price of the stock goes up, the option price goes up and the speculative enthusiasm expands the premium. Along with direction, the potential magnitude of the move has to be determined.

Magnitude

Analysis of a stock trade incorporates the potential magnitude of the price move. This involves analyzing where the next resistance/support might occur. Speed and magnitude of the previous move that is reversing is one factor. Congestion levels above the reversal area is another. Trend lines and Fibonnacci retracement levels are more considerations. But most importantly, the signal itself will dictate how strong the move could be. A major reversal signal, compounded with a gap up, will substantiate a much stronger advance than a secondary signal. The status of the stochastics should indicate how long the upside move can potentially be maintained. The analysis of the upside is going to dictate the ultimate trade strategy. And this has to incorporate the final element: Time.

Time

The weakest area of analysis for most option traders is the evaluation of time constraints. This is the area that human weakness is most likely to be involved. The direction and the magnitude not only have to be correct, they have to be correct in the proper time frame. For every day the option trade is in existence, time is working against the profits. This is experienced in two ways. First, the potential of the opportunity of a big up move lessens as the time for it to occur lessens. Secondly, as time diminishes, so does the investment fervor. Premiums also diminish as time passes away.

Time also becomes a major determinant in the type of option trade that should be established. Three weeks remaining before expiration will have a different trade strategy than one week remaining. A two-month option will have different strategies than a two-week option. The length of time to expiration dictates how to position the option trade.

Emotion is the major culprit causing option investors to lose money in 80% of option trades. Most “call” option buyers purchase the call due to some reason they think that will make the stock go up big. For example, let’s say the time frame is two weeks before expiration date. After the commitment of funds to the trade, the price does move up. Unfortunately, it does not move in the magnitude or speed to offset the diminishing premium built into the option price. Being correct in the direction of the move feeds the ego. The trade was correct. But if the magnitude of the price move was not great enough to offset the cost of the option premium, an emotional dilemma is created. Should the trade be liquidated or will the price move further, significantly more than its norm, between now and the remaining time to expiration? Gone is the original trade expectation and in comes “hope” for a positive resolution to the option trade.

Utilizing candlestick analysis emphasizes the discipline of placing as many controllable probabilities in your favor before a trade is established. Utilizing the steps for putting on a successful stock trade becomes all that much more critical when putting on an option trade. Each step needs to be scrutinized. Especially the final step, watching how a stock price will open. If the other steps have been followed, analyzing market direction, evaluating the sector chart, identifying a strong candlestick reversal signal, and seeing the stochastics in the proper area, then the final evaluation becomes an important element of the whole process – how is the stock price opening? The reason this step is vitally important is due to the time constraint on the option trade.

Implementing candlestick analysis into option trading greatly enhances the ability to make huge profits. Having the advantage of projecting direction makes option strategies simple. Identifying a candlestick “buy” or “sell” signal at the end of a trend allows the option trader to exploit option strategies that best extract consistent profits from the market, profits that take advantage of the 80% loss statistic. When other option traders are trading on less precise technical analysis, candlestick option traders can be executing trades precisely when the signals reveal the change in sentiment. Having the knowledge of spreads, straddles, and premium diminishing, expands the probabilities of creating the right option strategy for the right time and magnitude potential. The candlestick signals act as a guide for the active option trader. Learn the candlestick signals and the ability to extract huge option trade profits becomes a common practice.

Candlestick option trading programs have been developed to make “high” risk trading into a very low risk procedure. You can learn how to maximize the potential of an option move using different trading strategies. Having the foresight of direction the candlestick signals provide, the analysis of time and magnitude becomes simplified. The leverage of options produce inordinate profit potential.


Glossary of Option Trading Terms

Selling Calls – Bearish Options Trading Strategy

When an investor is feeling bearish on the market, another good stock option trading strategy to employ is Selling Calls or Selling Bear Calls. This method is also known by the name Vertical Bear Calls. This is considered a bearish strategy because the trader profits if the underlying stock decreases in value. Basically, the strategy is to buy out-of-the-money call options and sell in-the-money call options on the same stock with the same expiration date. The plan is that the in-the-money stock closes lower than its strike price at its expiration date, and then the trader realizes maximum profits from selling calls.

When selling calls, the investor will experience maximum loss when the stock price increases above the higher, out-of-the-money call option strike price at the expiration date. This loss will be the difference between the two strike prices minus the net credit of the spread when it was originated. While there is risk involved, this stock investing concept allows investors to find profits even when the market is bearish by selling calls.

The downside of selling calls is that, while it is lower risk than simply buying put options, it has a limited profit potential as well. The break-even is at the lower strike price plus net credit. The maximum profit potential is when the stock decreases below the in-the-money call option strike price. In such cases, the investor will review his / her stock trading plan to see if the data and potential risks of the strategy are likely to create successful trading when selling a call.

For example, an investor wants to sell calls on ABC, Corp. The stock price is $39.875. The trader sells an in-the-money call option with a June expiration at a strike price of $35 for $5. At the same time, the investor buys a out-of-the-money call option with a June expiration at a strike price of $40 for $1.56. Selling a call such as this is a net credit of $3.44, spread of $5, or the difference between the costs of the two options. If the stock price is lower the in-the-money strike price on the expiration date, this would be a maximum profit of the net credit when selling the calls: $5.00 – $1.56= $3.44 x 1 contract (100 shares) for a maximum profit of $344. Conversely, the maximum loss would be if the stock closed above the out-of-the-money strike price on its expiration date: $5.00 Call Spread – $3.44 net credit received = $1.56 x 1 contract for a maximum loss of $156.00. Because the risk is low, the risk reward ratios when selling calls are still very good.

A successful trader will adequately investigate such a move prior to selling calls. That way, he / she can be assured that the trade has a high probability of being successful. As with any trade, the investor needs to understand the risks and potential profits involved in order to make a wise decision. Using a stock trading system such as Japanese Candlesticks, the investor has access to charts that are understandable and powerful data in the attempt to sell calls to make a profit.


Return to main Options Trading Category

Sell Straddle – Neutral Options Trading Strategy

When the market has just made a dramatic move and it is expected to consolidate, a possible stock option trading strategy to implement is to sell a straddle. This technique involves selling a call option and a put option on the same asset with the same price and expiration date. The result is a known, albeit limited gain and the danger is unlimited risk. Selling a straddle requires extreme caution and constant monitoring of the position, and the investor must be confident of his, or her, assumptions on the direction of the stock. A Sell Straddle is definitely not recommended for all investors; the risk reward ratio is not favorable to anyone but the most vigilant trader.

In a Sell Straddle, the risk is truly unlimited. The gain is composed of the premium that is received for selling the call option and the put option, minus any commissions. In most cases, when selling a straddle, the put and call that are sold on options that are over priced and at-the-money or close to it. This is done in response to a dramatic move that has occurred, when the expectation is that the market will consolidate and absorb its gains before moving again. Since the market is extremely volatile, the cost of the options is very high. When the market does consolidate, stock volatility will decrease and lower the price of the options, increasing the profits when the investor buys back the options at a lower price to close the position. With a Sell Straddle, decay also works in favor of the investor. While this is a somewhat complex transaction, a Sell Straddle is an excellent stock market strategy for an experienced trader.

A Sell Straddle requires that the investor monitor the position for unfavorable movement and, if necessary, buy back one of the options if there is any indication that the market will resume its trend or reverse direction. If there is an indication that the market will trend up, the trader should buy back the call; if the market appears to be trending down, the trader should buy back the put.

As with any transaction, it is important that the trader do technical analysis with Candlesticks. This trading system will help the investor to understand the movements in the market before attempting to enter a Sell Straddle. By using a stock trading system like Japanese Candlesticks, a trader can not only identify the mood of the market, but identify a stock poised for an implementation of a strategy like a Sell Straddle. The charting ability of Candlesticks is perfect for options research and the investor can be move with confidence using this system.

While a Sell Straddle isn’t recommended for all traders, it is one of the investment options that can create profits for a savvy investor. Using a tested stock trading plan, good fundamental and technical analysis skills, and a system such as Japanese Candlesticks, a trader will find this strategy to not only be a benefit to the bottom line, but also a skill to know, and implement, in the future.


Return to main Options Trading Category