Archives for September 2019

Best Commodities to Trade

The best commodities to trade will depend upon a variety of circumstances, always including market timing. Commodity groups include energy, food and fiber, grains, interest rates, meats, metals, and stock indices. In all of these commodities markets there are factors that determine whether commodity prices will rise or fall when trading commodity futures. For traders with a great deal of expertise in a given commodity the best commodities to trade may be the most variable as these will be where the most profit potential lies. For the new comer to commodity trading the best commodities to trade may be those with less market volatility and, therefore, less risk of substantial loss. As with all trading it is wise to learn the basics first. Commodity and futures training is a good place to start. Learning the use of Candlestick charting techniques will help the beginning, and seasoned, trader to profit by anticipating price movement in commodities.

Often times commodity trading is trend trading. In the arena of traders there are followers of long term trends and short term trends. The longer the trend the more important it is to do fundamental analysis of the commodity involved. The shorter the trend the more important it is to do technical analysis. In all commodities trading fundamental and technical analysis have their places. For example, a trader who is expecting a long term rise in prices of corn futures will still want use tools such as Candlestick pattern formations to watch daily futures price movement in order to get the best purchase price even though he or she may be holding futures contracts for months or years. In trading commodities it is essential to know when large price movements usually occur. In trading agricultural commodities, such as live cattle commodity trading, a severe winter on the North American Great Plains may result in the deaths of many cattle. This will drive the price of beef up. An astute trader may see a weather map of a severe storm passing over Nebraska and Iowa and anticipate a drop in June live cattle futures.

Just as there is reason for diversifying a stock portfolio there can be reasons to diversify when trading futures on commodities. Although the possible return on investment in just trading interest rates or gold futures may be inviting, hedging in the form of trading a balanced portfolio of commodities may be safer and more profitable in the long run. Factors to consider when choosing the best commodities to trade are market liquidity as well as fundamental trends. For interest rates and currencies the trader will need insight into economics and politics as well as the banking systems of the countries involved. Trading oil futures, energy credits, natural gas futures and the like also require a sense of the economy as a recession can decrease demand substantially. Trading precious metals futures also has a lot to do with the economy and monetary policy. Many who trade in gold believe that the US and other nations will not be able to avoid inflation over time and, as such, habitually trade gold futures in the belief that the precious metal can only go up over time. A view of history will show that this is not the case as when gold prices plummeted in the 1980’s. In the end the best commodities to trade are the ones the trader knows the most about and is willing to follow closely enough to anticipate the market.


Market Direction

No Market Direction today due to traveling.

Chat session tonight 8 PM ET –  Tina Logan will be presenting this Thursday June 10th.

Good Investing,

The Candlestick Forum Team


Current Website Specials

July 2010

2-Day- Training Webinars 

Candlestick Technical Analysis Webinar – July 10 & 11

 Options Training Webinar – July 31st & August 1st

Trend Analysis- 50% OFF

Click here for details

Website special reflects current newsletter. If you are reading an archived newsletter you will be directed to Current Website Special.

Secondary Signals


Just like the Major Candlestick Images and Explanations page, this page provides all the information you need to learn the Candlestick Secondary Signals.

The Secondary Signals are titled as such because they do not appear as frequently as The Major Signals. That does not negate the effectiveness or their importance for identifying reversals. Being aware of the implications of these Secondary Signals in Candlestick Charts provides additional opportunities during the course of investment decisions.
 
Tri Start Signal

Tri Star Pattern

Recognition: The Tri Star pattern is comprised of a three-day pattern, all doji days.

Pattern Psychology:  Doji reveals indecision in the bull’s and the bear’s camp.  Any investor that had any conviction is now reversing their position.

Related Articles: Trading the Tri-Star Pattern
Training TutorialCandlestick Forum Flash Cards

Three Black Crows

THREE BLACK CROWS

Recognition: Three long black candles occur, after a strong uptrend, all of close to equal length.

Pattern Psychology: The uptrend has now reached levels where the sellers have started to step in. This persistent pressure by the Bears provides the potential for a strong downtrend.

Related Articles: Trading Three Black Crows Pattern
Training TutorialCandlestick Forum Flash Cards

3 Identical Crows

THREE IDENTICAL CROWS

Recognition: The Three Identical Crows have the same criteria as the Three Black Crows. The difference is that the opens are at the previous day’s close.

Pattern Psychology: After an uptrend a long black candle forms. However, the selling is more severe and there do not appear to be any buyers at the next day’s open. This indicates a much greater motivation to get out of the position.

Related Articles: Trading the Three Identical Crows Pattern
Training TutorialCandlestick Forum Flash Cards

TWO CROWS

Recognition: It is a top reversal pattern only after an obvious uptrend.

Pattern Psychology: After a strong uptrend has been in effect, the price gaps open but cannot hold its gains. The further the third day closes into the last white Bullish candle, the more bearish it is.

Related Articles: Trading the Two Crows Pattern
Training Tutorial: Candlestick Forum Flash Cards

Upside Gap Two Crows

UPSIDE GAP TWO CROWS

Recognition: Three-Day reversal pattern with a Gap Up in the Uptrend

Pattern Psychology: After a strong uptrend, there is  last gasp buying at the top causing a gap in price.

Related Articles: Trading the Upside Gap Two Crows Pattern
Training Tutorial: Candlestick Forum Flash Cards

Unique 3 Rive Bottom

UNIQUE THREE RIVER BOTTOM

Recognition: Three-Day reversal pattern at the end of a strong downtrend.

Pattern Psychology: After a strong downtrend the Bears would appear to be in control, but this rare pattern provides an early indication of a successful reversal ahead.

Related Articles: Trading the Unique Three River Bottom Pattern
Training Tutorial: Candlestick Forum Flash Cards

Three White Soldiers

THREE WHITE SOLDIERS

Recognition: Three-Day reversal pattern is easily identified by three large Bullish candlestick signals, an obvious pattern of buying.

Pattern Psychology: A strong downtrend or flat trading period with buyers  overcoming the early sellers.

Related Articles: Trading the Three White Soldiers
Training Tutorial: Candlestick Forum Flash Cards

3 in Up and 3 in Out

THREE INSIDE UP & THREE INSIDE DOWN

Recognition: Three-Day reversal pattern alerted by the appearance of a Harami signal.

Pattern Psychology: The Harami is the first indication that the trend has stopped.

Related Articles: Trading the Three Inside Up or Down Reversal Pattern
Training Tutorial: Candlestick Forum Flash Cards
 
Bearish Bullish Meeting Line

MEETING LINES

Recognition: Meeting lines are formed when opposite colored bodies have the same closing price.

Pattern Psychology: After a strong  trend, there is a continued gap in the direction of the trend. (see detailed description in Trading the Meeting Lines)

Related Articles: Trading the Meeting Lines
Training Tutorial: Candlestick Forum Flash Cards
 
Belt Hold Candlestick Pattern

BELT HOLD

Recognition: Strong trend in price, followed by a gap in the same direction as the trend.

Pattern Psychology: After a strong trend, there is a gap in the same direction but the opening price does not hold causing investors to begin covering their positions.

Related Articles: Trading the Belt Hold Pattern
Training Tutorial: Candlestick Forum Flash Cards

 
Breakaway Bearish and Bullish

THE BREAKAWAY

Recognition: A gap down found during a declining trend

Pattern Psychology:  If the gap does not fill the Bears have maintained control.

Related Articles: Trading the Breakaway Pattern
Training Tutorial: Candlestick Forum Flash Cards


3 Stars in_the South

THREE STARS IN THE SOUTH

Recognition: Obvious down-trend in stock price.

Pattern Psychology: The shadows, or tails, indicate that some buying has presented itself.

Related Articles: Trading Three Stars in the SouthThree Stars in The South.
Training Tutorial: Candlestick Forum Flash Cards
  
Advance Block

ADVANCE BLOCK

Recognition: In an uptrend, or a bounce up during a long downtrend, the candle bodies becoming increasingly smaller.

Pattern Psychology: Reveals a slowing of the buying.

Related Articles: Trading the Advance Block Pattern , Advance Block Pattern
Training Tutorial: Candlestick Forum Flash Cards
 
Deliberation

DELIBERATION

Recognition: Uptrend in stock with candle sizes diminishing.

Pattern Psychology: A slow down in represents buyer weakness

Related Articles: Trading the Deliberation Pattern
Training Tutorial: Candlestick Forum Flash Cards

 
Stick Sandwich

CONCEALING BABY SWALLOW

Recognition: The pattern is in a downtrend, two large black candles continue the downtrend and is followed the third day with a gap down reverse hammer formation.

Pattern Psychology: While the trading ended at the low, the magnitude of the downtrend is greatly diminished.

Related Articles: Trading the Concealing Baby Swallow , Concealing Baby Swallow
Training Tutorial: Candlestick Forum Flash Cards

 
Stick Sandwich

STICK SANDWICH

Recognition: This pattern looks similar to an ‘ice cream sandwich’., with one white candle sandwiched in between two dark candles.

Pattern Psychology: The Bears are forced to cover short positions upon seeing new buying strength coming into the market.

Related Articles: Trading The Stick Sandwich
Training Tutorial: Candlestick Forum Flash Cards
 
Homing Pigeon

HOMING PIGEON

Recognition: Similar to the Harami except for the color of the second day’s body.

Pattern Psychology: The appearance of support in a strong down trend gets enough attention from the Bears that they begin covering their short positions.

Related Articles: Trading the Homing Pigeon
Training Tutorial: Candlestick Forum Flash Cards
  
Ladder Bottom

LADDER BOTTOM

Recognition: A strong downtrend is in effect with the reversal apparent with a gap up on the fourth day.

Pattern Psychology: The gap up causes the Bears to start scrambling to cover their positions before the Bulls take over.

Related Articles: Trading the Ladder Bottom
Training Tutorial: Candlestick Forum Flash Cards
 
Matching Low

MATCHING LOW

Recognition: A downtrend is in place when two trading days close on their lows, at the same level.

Pattern Psychology: The Bears get uneasy upon seeing their presence is no longer moving the price down.

Related Articles: Trading the Matching Low
Training Tutorial: Candlestick Forum Flash Cards

This is the last pattern in our series for Candlestick Secondary Signals. You are now ready to move on to Candlestick Continuation Patterns.

Trading Futures Contracts

Futures contracts are contracts on currencies, stock market indexes, or commodities. These contracts attempt to predict the value of these securities at some date in the future. When dealing with commodities, trading futures contracts is a commitment to deliver or to receive a specific amount of a commodity during a specified month at a price that is determined by the futures market. When you sell a futures contract, it means that you have an obligation to deliver the commodity by a certain date and conversely when buying a commodity you have agreed to buy the commodity at a specific price at a specified date. When trading futures contracts, most of the time, the trade never ends in an actual delivery of the asset, but instead these contracts are closed out before the delivery date. The purpose of futures markets in general is to provide a useful and competent means to manage price risks and the purchasing of futures is done through discount brokers and full-services brokers. Futures trading requires that the investors accept price risks from producers with the goal of making a profit.

There are advantages and disadvantages to trading futures contracts, both of which will be discussed in this article. The risks apply more to the speculators and this is due to the fact that futures orders are typically bought on margin. In fact, futures traders only have to deposit five to ten percent, and the rest of the contract can be bought on margin. Additionally, it is very easy to lose your original investment in a volatile market and is therefore suggested that only professionals trade in the future markets. Investors also must be aware of the tax consequences due to the high amount of leverage that can create huge capital gains and losses.

The advantages to trading futures contracts deals with the concept of hedging. The goal is to obtain a perfect hedge when you trade futures. Basically, you can opt to sell your commodity at the current market price or you can “lock in” a price for your commodity to be sold at a specific price at specific time in the future. This comes in handy for farmers who must speculate what their commodity will cost at a specific date in the future. (Many farmers must wait until harvest so they don’t know that the current market price will hold). If the farmer is content with the price of the commodity today, then they will sell the futures contract to guarantee that they will get today’s price at a future date. Additional advantages to online futures trading include the fact that futures markets are very active so you can liquidate contracts quite easily. Basically, trading futures is very useful to reducing any unwanted risk.

Trading futures contracts is a great way to invest money however it is not easy. Many people suggests that only professionals do it, but if you study, understand what you are doing and approach it as a professional would, then there is no reason that it can’t be a great way to invest for you.


Market Direction

Candlestick analysis creates a number of parameters that becomes a built in discipline. The reason most investors do not make money is because of their own emotions. When we make the decision to put our funds at risk, we have also inherently put a piece of our ego to the test. It is our mental capacities that will be judged based upon whether a trade makes money or loses money. When we make money with a trade, our self worth expands greatly. When we lose money on a trade, mentally we judge ourselves as losers, stupid, and many other derogatory feelings that we feel about ourselves. We hate to lose. That is what causes most people to let losses keep growing. Once we decide to close that trade as a loss, we have now solidified the fact that our mental processes were flawed. If we keep the position open, maybe it will come back to positive. Then we would be validated as a winner, not a loser.

Unfortunately, the markets did not care what you do or what you think. The markets are going to do what they are going to do. How you perceive what those movements may be has nothing to do with the market movements. Candlestick analysis provides a visual format that greatly reduces the emotions of investment decisions. The markets move in patterns. Candlestick signals help illustrate what is occurring and has occurred many times in the past. The caveat to that statement is adding “with a high degree of probability”. Candlestick analysis is merely the evaluation of investor sentiment. Investor sentiment works in a specific manner most of the time. Utilizing the information that is built into candlestick patterns and signals provides a visual format for recognizing the next reoccurring price movement.

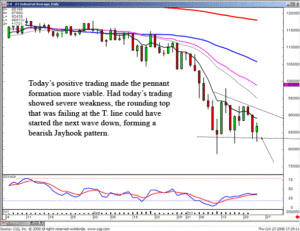
This is powerful information. This makes evaluating what is occurring in market/price trends at critical levels. This is clearly evident in the Dow. The recent congestion of the past two weeks is providing analyzable forecasts for what the market might do from this area. The trend analysis becomes much easier knowing what occurs after the completion of specific patterns. As described in earlier newsletters, the dumpling top forecasts the potential of an extremely strong downtrend. Once that downtrend has completed, a new set of pattern potentials present themselves. The J-hook pattern, for example, is usually a result after an extremely strong price move. The recent strong downtrend could be the precursor to a bearish J-hook pattern. That possibility still exists if the Bears can push prices to new lows over the next few days. The failure of the Bulls to be able to close trading above the T-line provides more credence to the bearish J-hook set up.

Futures, DOW example

DOW

Today’s bullish trading provided more evidence of a possible pennant formation. Positive trading from this level would make that prognosis more viable. In either case, an investor can make a reasonably intelligent assessment of what to do based upon what patterns may be setting up. Continued weakness from this level would warrant shorting positions or buying the short funds. Witnessing more bullish trading would make the pennant analysis more feasible. This would lead to looking for long positions. However, any long positions established would be done so with taking quick profits if the top of the pennant formation showed resistance.

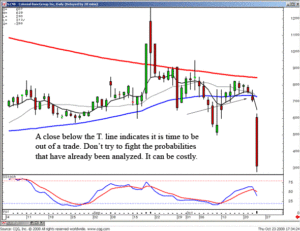
Candlestick signals forming at support and resistance levels gain that much more credibility when analyzing what new price pattern could be developing. The T. line has become a very valuable technical level to watch. Buying a position after a candlestick buy signal can be maintained as long as it does not close back below the T. line. The research that has been performed involving the T. line produces a simple format for when to stay in and when to get out of a position. The Japanese rice traders did not have this technical indicator to help confirm candlestick signals. The benefit we have today is adding computer-aided technical indicators to help improve the probabilities of candlestick signals.

Futures, CNB Example

CNB

Because we are constantly trying to find trading techniques that dramatically improve our probabilities of making money, to disregard what has already been proven now becomes a detriment to your account balance as well as your mental perspectives. As often stated, this is not rocket science. This is merely combining information continually improves your trading abilities. Learn how to use candlestick signals correctly. Once you do, you’ll have a completely different perspective on how to invest successfully. Your emotions would not continue to be a flaw.
Chat session tonight at 8 PM ET – open to everybody, bring the kids, teach them how to invest correctly at an early age. You do not want them to go through investment hard knocks like most of us had to do most of our lives. Click here for instructions.

If you already have HotComm installed, click here to connect.

Good investing,

The Candlestick Forum Team


Candlestick Analysis Technician

2-Day Training Seminar Package – 40% OFF!

5-Cd Pack with Training Manual
Bonus CD Scanning Techniques to Higher Profits (valued at $187.77)
Double Bonus – Free 30-Day membership to The Candlestick Forum (valued at $97)
Website special reflects current newsletter. If you are reading an archived newsletter you will be directed to Current Website Special.

Profitable Day Trading Using Candlestick Charts

Day trading, a trading technique popularized to the general investing public in just the past 5 to 7 years. This phenomenon resulted from the severe market daily declines in 1987 and a few in the early 1990’s. The huge down days made it impossible for investors to get in communique with their brokers. So, it was legislated that access to the markets had to be available to everybody, thus the electronic trading systems. Day trading blossomed in the early to mid 90’s.

However, the original day trading techniques, having electronic signals showing quick arbitrage situations, producing huge profits, has disappeared over the past two years. But day trading is still very profitable when used with candlestick signals. The old methods disappeared, but new products were developed that made day trading still viable. The exchanges set up market index trading entities. The Spiders for the S&P index, the Diamonds for the Dow and the QQQ’s for the Nasdaq. These highly liquid trading entities make for excellent trading vehicles for day trading.

Fortunately, candlestick signals clearly illustrate the change in investor sentiment for any time period; monthly, weekly, daily, hourly or by the minutes. A minute chart is valuable for the day trading technique. Combining stochastics with candlestick signals, even on a minute to minute basis, produces highly accurate results. Day trading has a very viable platform to work from when the signals and stochastics coordinate.

Producing the right combination of time segments can formulate low-risk, high potential day trading setups. For example, the active day trader may use the 1 minute, 3 minute and 10 minute charts to establish their trades. The 1 minute, 5 minute and 15 minute chart combination works extremely well. Other day trading programs, set for two or three trades per day, may use the 5 minute, 15 minute, one-hour combination.

Combining multiple charts creates a basis for catching the intraday trends. Day trading in this manner requires getting in and getting out of trades right at the reversal points. The candlestick signals provide this information. Day trading without a method to take advantage of accurate reversal signals produces much reduced profits. Day traders should utilize candlestick stock analysis for clear entry and exit strategies.

Note in the following example that observing all three charts may produce validity to a day trade. Day trading becomes easier when the visual road map can easily be determined.

Candlestick Day Trading

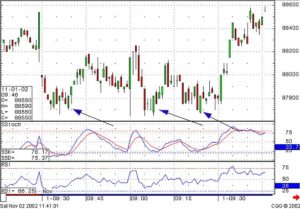
Note how the one minute chart of the S&P, a favorite of the day traders, keeps revealing candlestick “buy” signals at the same support area. Those signals would alert the candlestick investor to the fact that buying was clearly obvious every time the sellers brought the S&P down to this level. Day trading these “buy” signals would require some visual backup.

Day Trading Chart 5 min

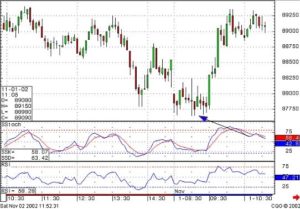
The five minute chart reveals the same factors. Oversold stochastics. The shadows are all showing support at that one level. The Spinning Tops are demonstrating indecision. Now the 15 minute chart should be perused.

Candlestick Day Trading Chart, 5 min

This day trading technique can be applied to any trading entity that has sufficient volume. Using the signals at the proper stochastic period can produce consistent day to day profits. Mr. Bigalow has traded the S&P E-Mini’s for years. Use the forum, chat room or e-mail the site to learn more about how to use candlesticks with your own day trading program.

Other Day-trading articles of interest

The Dynamic Doji
One of the most revealing signals in Candlestick Trading

Effective Stock Market Trading Systems
Why try to swim against the current – Trade with the market trend

Futures Trading Plan – Planning For Success


Any great endeavor starts with a great plan. What would the Eiffel Tower look like if there were no plans? Or if the builder of your new house want to just “figure it out as I go” would you allow him to build? Great successes are born from great planning and this is true in the futures market when your trading rules create a successful futures trading plan.

What is a Futures Trading Plan?futures trading plan is similar to a stock trading plan; both represent your set of “terms and conditions” for making trades. By establishing your futures trading plan before you enter the market, you can establish rules void of the emotions that will grab you in the heat of the moment. Why is this important? Whether things are going well or poorly, there is a tendency for people to react emotionally. Emotions are a great thing normally, but a poor guide when you are making major money decisions with your investments. Some things you might want to include in your futures trading plan are:

  • A Beginning Amount to Start – This is important not only from an investment prospective but from a personal one as well. It is important to understand that there is a direct relationship between the amount of capital invested and the probability of successful trading. Professional recommend starting your investing with a minimum of $10,000; starting with less may leave you vulnerable to greater risk since you can’t apply proper risk management principles. Starting with less than this will put you at a disadvantage but you can overcome it with a conservative approach. Remember the story of Richard Dennis; he isn’t the typical investor but he built a $200 million fortune from just $1,600. 
  • Counting the Cost – Your initial investment shouldn’t only be considered the amount you are willing to invest but the amount you are able to lose. This is the reason it is called “risk capital”. Risk capital is defined as money you can afford to lose without affecting your standard of living. It should also be money that you feel comfortable risking. Think of your commodity account as an investment in a business. Many businesses fail; that’s life. If you aren’t afraid of losing your money you are more likely to make correct trading decisions.
  • Being in the Trenches – Every investor needs to map out a strategy in their futures trading plan for the actual buying and selling decisions. Some people are very disciplined and able to remember the general principles of defensive investing while others need a plan for every scenario possible. Be honest with yourself and evaluate your tendencies. This is not some indictment on your character; this is your only opportunity to protect you investment, so be thorough and honest.
  • Stop Loss Plans – No one wants to think about what they if they lose; everyone wants to win every time but in a futures trading plan. This becomes part of a stop loss strategy. There are defensive techniques for not only recognizing when to get out of a buy but also how you should do it. Without solid charting and analysis, it is impossible to determine whether a downtrend is temporary or devastating.
  • Technical analysis – This is the backbone of any futures trading plan. Through charting and research, an investor has the best view of which direction a commodity is heading and why. Committing to a trading system like Japanese Candlesticks is invaluable to accomplishing your technical analysis due to its powerful charting principles.

Principles to Live By
There are four central precepts for every futures trading plan; these principles should be written at the top of your futures trading plan and posted next to your computer. These principles are:

  1. Trade with the trend
  2. Cut losses short
  3. Let profits run
  4. Manage risk

These rules outline everything that is important in a futures trading plan and everything else that you include must recognize these for principles. By establishing your futures trading plan you are able to learn the ideas of successful and profitable investing in the futures markets.

Commodity Trends

In trading commodities traders follow trends, anticipate market reversal, and use technical analysis tools such as Candlestick chart patterns to trade successfully when a commodity establishes itself in trend or a trading range. Commodity trends vary with the type of commodity. Trends differ over short or long term. However, technical analysis with Candlestick charting will predict future market moves as successfully with corn futures or gold futures as it did in the rice market in Japan during the reign of the Samurai. Trading of commodity trends can be very successful so long as the trader uses both fundamental commodity analysis and technical analysis indicators to verify the probability of the trend lasting or reversing. Learning how to trade commodity trends and market reversal is part of commodity and futures training.

Commodity prices and commodity trends are based on the laws of supply and demand. However, when the exact supply and the exact demand are unknown the market will speculate. Knowing the fundamentals of how a commodity is produced and the depth and breadth of its market is essential to successful commodity trading. Knowing the fundamentals always helps the trader reduce and manage investment risk. However, to profit from trading futures in commodities the trader will need to be able to read the market. Trends tend to establish themselves when the market is in consensus about the prospects of a commodity price. When a recession hits traders in oil futures will want to sell short on the way down and will continue to do so as long as they believe that the price has not reached a fundamental support level. Understanding support and resistance zones is essential in successful trading of commodity trends. With knowledgeable use of Candlestick trading tactics a trader can do well trading commodity trends or predicting and profiting from breakouts.

Long term trends are essentially an organic part of a market. For example, the development of a new seed variety may substantially increase corn production and cause a long term decrease in the price of corn futures. On the other hand a drought in a major crop growing area will probably only raise prices for a year or until the next rains. Knowing and understanding the nature of trends will help the trader profit by them. The longer term trends are typically due to fundamentals. Short term trends in commodities or other trading are typically due to market sentiment. In reading market sentiment the trader will rely on Candlestick analysis to let the market tell him when the market will do. Everyone has the same fundamental information but everyone buys or sells a little differently. The psychology of the market is such that commodity trends feed upon themselves, almost to excess. Knowing when to stay with the trend when to go against it comes with experience and the use of tried and true trading tools such as Candlestick basics. What worked for Japanese rice traders centuries ago can work for traders today.


Market Direction

The major benefit of candlestick analysis is that it can accurately evaluate all markets and all time frames . For the active trader, this is very important information. If you love trading stocks, you have a relatively large market to deal with. However, most of the active trading occurs in the first hour and a half in the final hour. The market trades relatively blasé during the middle part of the day. For an active trader, this can be a problem. Wanting to trade actively during the middle part of the day may lead to pushing trades that should not be executed just for the sake of staying active. There are better solutions.


Commodity markets usually open up 30 minutes to an hour after the stock market opens. They usually close prior to the close of the stock market. This allows a trader to trade actively during the first and last hours of the stock market trading, then participate in some commodity trading during the middle part of the day. This allows the active trading to be spread over the full length of the day. Fortunately, successful commodity trading utilizes the same confirming indicators as stock trading. The charts work equally well on bond charts, currency charts, or any other trading entity that involves human participation.

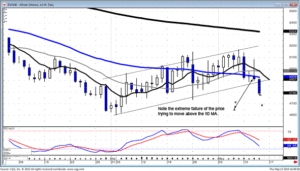
Investing successfully in commodity charts is very simple. It takes the same logic and visual analysis found in stock charts. For example, July Wheat was shorted today based upon a few simple chart analysis techniques. A failure of the 50 day moving average yesterday was an indication to watch for further weakness today. If that happened, the trend channel would be breached. This would set up the possibility of a strong leg to the downside.

Commodity Trends, Wheat
Wheat

Having the ability to recognize when a high probability trade is going to occur creates the opportunity to make much bigger profits trading commodities than trading stocks. The leverage in commodities make say price move extremely worthwhile.

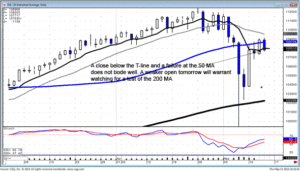
The Dow held up  well today after a few days of strong buying for the most part of the day. The immediate consolidation took the Dow back down to the tee line first thing in the morning. It acted as support. The rest of the day traded relatively strong, considering there was a good amount of profit taking occurring today. The selling strength returned going into the close. This makes the prospects of a strong recovery in the markets more dismal. However, the strong charts still revealed continued strength. Because of the severity of the last downtrend, when buyers came back into the markets, they did so with an extensive amount of enthusiasm. This can be seen in the number of candlestick reversal signals and gap ups in price.

Commodity Trends, Dow Example
DOW

Commodity Trends, FNSR
RHT

Utilizing these simple rules helps an investor trade much more calmly. Many investors get scared out of a trade that is not producing a true reversal signal. They will not attempt to get back in because it would make them look foolish to sell out and then buy it right back. Using the simple rules applied to candlestick signals in the confirming indicators keeps an investor from entering a trade they should not get in and keeping them in trades they should not get out. This benefit allows an investor to concentrate their efforts on analyzing for new trades. Mental time and effort will not be wasted on price trends that are just zigging when the uptrend is still in progress. The benefits of these techniques are more apparent when trading commodities. Small price moves in a commodity trade equats to great differences in profits or losses. Learn how to apply simple trading rules to your investing and you will gain a much better comprehension for when trending prices are merely having small pullbacks.

Commodity traders — Do you know how to evaluate which trade or trades have the highest probabilities of producing profits? Have you ever analyzed two trades that look good. You decide upon placing a trade in one. It doesn’t move, but the other one takes off like a rocket. What could you have done to decipher which one was going to have the greater probability of moving. Not only moving, but moving with a much greater strength. The Candlestick Forum will be providing a two-day commodity trading training session. Candlestick signals makes the opportunity for improving your returns for stock trading dramatically better. Using candlestick signals in commodity trading greatly improves the potential of making huge profits. Join us on May 22 and 23rd for a concentrated two day training session for successfully trading commodities. The analytical techniques found in his training will improve all aspects of your candlestick investing. 

Chat session tonight at 8 PM ET

The Candlestick Forum Team


This Week’s Special

Projecting Price Targets – Quickly learn to spot the most profitable price targets! – BONUS EBOOK with purchase!!!

2-Day-Commodity Training Webinar

Click here for details

Website special reflects current newsletter. If you are reading an archived newsletter you will be directed to Current Website Special.

Stock Market Information on How to Trade the Shooting Star Signal

There is no shortage of stock market information, whether you are researching the internet or the book stores. Be prepared to be flooded with material covering stock market information. The biggest decision is how to go about selecting which materials to start reading. Do you want to learn about day-trading? Are you more interested in learning options, or trading commodities? Maybe you  want to be better educated to discuss your portfolio with your Broker. How do you know if the stock market information you are reviewing was written by someone qualified in the subject? Perhaps you will allow us to narrow the field a bit. Stephen Bigalow is not only the author of ‘High Profit Candlestick Patterns’, and ‘Profitable Candlestick Trading’, but He Trades For A Living!    The same information he teaches throughout this website, and in all his training products, is the same information he uses every day to make his own trading decisions.  He contributes new articles each week to aid other investors on the advantage of combining candlestick signals and how to read candlestick charts. We hope you enjoy the following training information for the Shooting Star Signal. For additional articles on trading individual candlestick signals please begin with Candlestick Images and Explanations.

Shooting Star Candlestick Pattern

The Shooting Star

Description

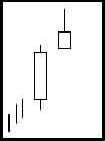
The Shooting Star is comprised of one candle. It is easily identified by the presence of a small body with a shadow at least two times greater than the body. It is found at the top of an uptrend.  The Japanese named this pattern because it looks like a shooting star falling from the sky with the tail trailing it.

Criteria

  1. The upper shadow should be at least two times the length of the body.
  2. The real body is at the lower end of the trading range. The color of the body is not important although a black body should have slightly more bearish implications.
  3. There should be no lower shadow or a very small lower shadow.
  4. The following day needs to confirm the Shooting Star signal with a black candle or better yet, a gap down with a lower close.

Signal Enhancements

  1. The longer the upper shadow, the higher the potential of a reversal occurring.
  2. A gap up from the previous day’s close sets up for a stronger reversal move provided.
  3. The day after the Shooting Star signal opens  lower.
  4. Large volume on the Shooting Star day increases the chances that a blow-off day has occurred although it is not a necessity.

Pattern Psychology

After a strong up-trend has been in effect, the atmosphere is bullish. The price opens and trades higher. The bulls are in control. But before the end of the day, the bears step in and take the price back down to the lower end of the trading range, creating a small body for the day. This could indicate that the bulls still have control if analyzing a Western bar chart. However, the long upper shadow represents that sellers had started stepping in at these levels. Even though the bulls may have been able to keep the price positive by the end of the day, the evidence of the selling was apparent. A lower open or a black candle the next day reinforces the fact that selling is going on.

Candlestick Forum Services

The Candlestick Forum provides the ultimate trading environment. Giving the individual investor essential tools to profit in any market! Trade with Stephen Bigalow and our active member community.

FREE PUBLIC SERVICES

Stock Chat
Stock Chat is a weekly live internet presentation provided by Stephen Bigalow. These interactive sessions begin with reviewing current market conditions, and charts of interest. Mr. Bigalow illustrates ‘charts of interest’ poised to make profitable trading candidates. A Question and Answer period at the end of each session where YOU may ask for review of specific trades and answers to questions on technical analysis. Click HERE for more details.

Free Newsletters
Timely market advice provided completely free of charge or obligation! Twice weekly publications for evaluations of the DOW, NASDAQ, S&P, Bonds, and other market entities. Each newsletter includes interesting and profitable elements of candlestick signal formations with insights into why a price move occurred. Plus, alerts for upcoming free webinars and website specials. Who knows, perhaps one of these articles will change your financial future! Your email address is kept strictly confidential and will never be sold, traded, or shared with any third party. To signup, scroll up to the top of your screen and enter your email address in the ‘Free Newsletter” field – PLUS, Receive free download.

Free Resources
Your One-Stop Shop for Japanese Candlesticks! This area is packed with all the ‘How To Trade’ details for each candlestick signal. The basics of Japanese Candlesticks, the Twelve Major Candlestick Patterns, Secondary Signals, and Continuation Patterns. All the signals include illustrations, pattern recognition, psychology behind the pattern and related articles. Each Signal ready to Print and save for Quick Reference! Click HERE to go to Free Resources.

Daily Stock Market Reports
Start your trading day with Stephen Bigalow’s market comments to know where the stock market is heading. Plus, Monthly Archives of Steve’s Personal Trading Diary. See what goes into his analysis in search of profitable trades. Click HERE to go to Daily Stock Market Reports.

Events and Training
Mr. Bigalow gladly supports trading clubs and frequently accepts invitations to speak. Keep track of upcoming locations in your area. Look for announcements for Where in the Heck is Stephen Bigalow, he may be attending an event in your area. Click HERE to go to Events & Training.

Discussion Forum
Enter the Discussion Forum and enjoy a community of traders, helping each other! This is open to the public and one of our most popular free formats where fellow traders share hot tips and trading techniques. Always open!


PAID MEMBERSHIP SERVICES


Live Trading Room
This active Trading Room is reserved for Members’ Only. Our Moderated Internet Stock Chat provides the perfect format for success. Stephen Bigalow begins just before the Opening Bell with a brief pre-market review, open positions review, and is available for specific questions during the first and last hours of the trading day. Our Moderator shares charts of interest as new trading opportunities developed during the day. This Live audio/video chat room is active with serious traders sharing their techniques and is included in all membership subscriptions. There are NO additional license fees or charges for accessing the HotComm Platform. (If you have already joined us for our FREE open Stock Chat on Thursday evenings, the Members’ Trading Room is the same HotComm Platform.)


Daily Market Comments
Not everyone can be online live during the market hours. (Darn those pesky Day Jobs!) Access the morning and afternoon member market Comments for a brief summary of market conditions and important updates on open stock positions.


Daily Stock Picks
Chosen by Stephen Bigalow as the best trade potentials for the day. These are more than simple  ‘buy and sell’ XYZ – Every market day Steve selects 2 -3 of his favorite stocks. Presented in a ‘Flash’ video to illustrate the setup with instructions for entry points and stop loss settings.


Long Term Stock Picks
One Long-Term Stock Pick is selected each month for consideration to add to your portfolio. The same format as our Daily Picks but geared for a longer holding period. And, like our our Stock Picks, Steve reviews these during the weekly Member Only Stock Chat.


Stock Chat
Members receive a private – Members’ Only Stock Chat each week. These sessions run approximately one hour and typically held on Monday evenings at 7PM ET. An invaluable hour to ask Steve to review any stock chart and answer specific trading questions. The first 30-minutes Steve provides a market overview and updates on open Stock Picks. There are ‘Bonus’ Stock Chats from time-to-time with Guest Speakers to introduce new trading techniques. Plus, our Moderator frequently adds a special Sunday night session for planning for the week ahead. All Stock Chat sessions are recorded and available for playback within 24 hours.


Commodity Picks
One Commodity Pick each month with ‘Flash’ video review provided by Stephen Bigalow. If you are new to commodities this will give you a great training ground. Commodities do not move the same as the stock market and on occassion when the previous Commodity Pick is still going strong, we continue before selecting a new one.


Open Position Followup
There are two formats available to review open Stock Picks – A ‘Flash’ video is available for an audio/video review of all open positions – OR – You may choose to select a ‘Text Only’ format for print-out.


Position Summary Table
All open Stock Picks are formatted into a spreadsheet and can be sorted by all column headings that allow you to review new, open, or closed Stock Picks. This provides for quick sorting by Symbol, Date, Long or Short Positions, Entry Range, Stop Loss, Position Status (new – hold – closed – not executed), and Action Alerts. As an added feature, click on each stock symbol for quick direct to the ‘text’ followup.


Free Video of the Month
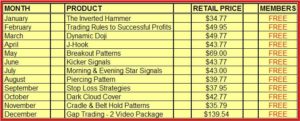
Each Month Members receive a new Product for Quick-Download – FREE as part of membership subscription. The schedule below lists the FREE Member Downloads for 2007

Member Video Schedule 2007
 
Member Discounts
Members receive a 10% discount on all Products and Services – Always!
Plus, new members receive an immediate coupon for 20% off  first purchase!


We believe you will agree the benefits of Membership are a wise investment at a great value!
Need  a little  incentive?….
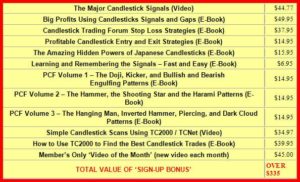
Look below for the FREE Products you receive for Quick-Download immediately after you join!

New Sign Up Bonus
 

All membership periods renew automatically until cancelled. Should you decide the Candlestick Trading Forum is not for you, simply cancel the automatic renewal from your member profile or contact us to discontinue automatic renewal. You keep $335 worth of new membership products just for trying The Candlestick Trading Forum.

Participate with other serious investors and become part of  the Candlestick Trading Community

JOIN NOW!

Options Trading For Beginners – Getting Started

No matter what you do in life there is always a first day. Walking as a baby, driving a car or starting a new job all fall into this category. This is true of beginner’s options trading in the stock market as well. Even if you have experience trading stocks you might not know the difference between a call and a put; don’t get worried because this isn’t going to lead to a pop quiz. What is going to happen is that we will look at options trading for beginners and give you some of the basics to get you started. If you have never been exposed to options trading, welcome to your first day!

What Are Stock Options?

Let’s start our beginner’s options trading discussion with the topic of what options aren’t. Stock options are not ownership in anything; unlike stocks, the holder of an option doesn’t possess part ownership in a company; this is simply an agreement between two investors that one party agrees to deliver something to another party within a specific time period and for a specific price. This eliminates the ownership part of the agreement as well as the idea that you must possess a particular stock in order to implement a position. Interested in selling short an option? In the stock market you have to borrow the stock to do it; in options trading beginners only need to understand that there is no ownership and no problem making the transaction.

What Are the Advantages of Stock Options?Options have a number of nice advantages that the options trading beginner should understand. Among these benefits are:

  • Leverage – Options also have the advantage of leverage; your option is purchased with a multiplier of 100 so your fortunes are affected by 100 shares of stock and not only one.
  • Limited Risk – This is not true of all options investing, but overall options trading has limited risk. When buying options, your risk is limited to the price of the premium, or the amount you paid for the option. For example, if you buy straddle (the name for a particular option) and the price of the stock is wrong for your position, you can, in essence, allow the option to expire. This offers a great start in options trading for beginners since they can purchase options without the fear of staggering losses.
  • No Risk Paper Trading – Thanks to the power of the Internet, paper trading has become a valuable asset for the options trading beginner. You simply register to use the software and follow the directions of the site. You will be able to implement positions and see the effects of your decisions on your “account”. Lose your money? No problem, it was only virtual money but a real experience beginner’s options trading.

What Do You Need To Do To Get Started?
Getting started is never really difficult. Remember, it is your first day. However, there are several things you need to do as a beginner in options trading:

  1. Start Learning – There is no substitute for education. Read books about options trading, talk with others that trade options and search the Internet for information about options trading. Once you start investing your own money, you will be glad to understand options trading.
  2. Create a Stock Trading Plan – This is just as important as your education. You need to outline your goals and objectives as well as your strategies in an unemotional manner. This way, when emotion tries to creep into your decision making process, you will have already decided your course of action.
  3. Select a Broker – This is a personal, but important part of the process. You can implement your own trades but you need someone to actually place the orders. Some full-service brokers offer more services and most Internet brokers offer lower commissions. Even though you’re a beginner in options trading, define what you want from your broker and find someone who meets your needs.
  4. Use Japanese Candlesticks – This powerful charting system will help not only the beginner in options trading but is valuable to the “expert” as well. Candlesticks will help you to find the trends in the market that most others miss.

Conclusion
Is that enough information for your beginner’s options trading lesson? Remember that this is your first day but everything you do will build off of it.

Children and the Stock Market – When Should They Learn To Invest?

The concept of children and the stock market seems as logical as mixing nitrogen and glycerin in a blender in your kitchen. Children joining the stock market community? Shouldn’t they be playing PlayStation 2 or 3 now? In reality, the combination of children and the stock market and the world’s future is a natural fit. Remember, most of today’s baby boomer investors didn’t have a home computer or video game when they were kids; this generation can save the universe courtesy of Sony and other program creators. There are some keys to introducing your children to the stock market, so let’s get started.

First, it is imperative to start this adventure with a good understanding of stock market basics. You can start by teaching those youngsters that investing is totally different from saving. You might “save” to buy a new bike, but “invest” to have the money for college. Next in the process of combining your children and the stock market would be to cover topics such as portfolio diversification, liquidity, and risk reward ratios.

Ready to give your kids the family fortune yet? Let’s hope not! Before the kids actually start picking stocks and investing with real money, it’s best to start with a mock portfolio. There are a variety of ways for kids or anyone else to practice online stock market trading. There are a number of online games for stock and option investing simulation games. Prefer FOREX currency trading for beginners?  It’s there too. Or if you enjoy the more traditional method, you can do this all on your own by helping your child construct and track his/her own portfolio of stocks. It’s also wise to encourage your children to “invest” in companies that they know, such as Disney, Coca Cola, Nike, or Microsoft.

While in the stock market, you can teach your children to track their investments, practice money management techniques, monitor company performance, research each investment, and track trends in the market. Junior probably has a good idea if Sony will impact Microsoft’s profit when the PlayStation 3 is launched. This is also a great opportunity to begin teaching the concepts of Japanese Candlesticks stock trading to your children in the stock market. Chances are, they will pick up the principles much quicker than poor old dad!

Once you, and your kids, are ready for the stock market, there are a several investment options you can choose from. The safest course is probably finding a mutual fund. Although this is not the most exciting option, there are “kid friendly” mutual funds available, and actually some that provide stock market investing education materials as well. All of the principles your kids have learned apply and the bottom line results are real.